Monthly Archives: December 2014

Open URL From Today Extension

A friend of mine mentioned in passing that he was having trouble getting an obvious, well-documented behavior of his Today extension to work … as documented. According to Apple, a Today extension should use NSExtensionContext when it wants to open its host app, e.g. to reveal a related data item from the Today widget, in the context of the host application.

A widget doesn’t directly tell its containing app to open; instead, it uses the openURL:completionHandler: method of NSExtensionContext to tell the system to open its containing app.

They even cite one of their own apps as an example:

In some cases, it can make sense for a Today widget to request its containing app to open. For example, the Calendar widget in OS X opens Calendar when users click an event.

The idea is you should be able to use a simple line of code like this from within your Today extension. E.g., when a user clicks on a button or other element in the widget, you call:

[[self extensionContext] openURL:[NSURL URLWithString:@"marsedit://"] completionHandler:nil];

Unfortunately this doesn’t work for me, for my friend, or I’m guessing, most, if not all people who try to use it. Maybe it’s only broken on Mac OS X? I was curious, so I stepped into the NSExtensionContext openURL:completionHandler: method, and observed that it essentially tries to pass the request directly to the “extension host proxy”:

0x7fff8bd83b03:  movq   -0x15df0b7a(%rip), %rax   ; NSExtensionContext.__extensionHostProxy

But in my tests, this is always nil. At least, it’s always nil for a Today widget configured out of the box the way Xcode says it should be configured by default. So, when you call -[NSExtensionContext openURL:completionHandler:] from a Today widget on OS X, chances are it will pass the message along to … nil. The symptom here is the URL doesn’t open, your completion handler doesn’t get called. You simply get nothing.

Getting back to the fact that Apple used Calendar as their example in the documentation, I thought I’d use my debugging skills to poke around at whether they are in fact calling the same method they recommend 3rd party developers use. If you caught my Xcode Consolation post a while back, it will come as no surprise that an lldb regex breakpoint works wonders here to how the heck Apple’s extension is actually opening URLs. First, you have to catch the app extension while it’s running. It turns out Today widgets are killed pretty aggressively, so if you haven’t used it very recently, it’s liable to be gone. Click on the Today widget to see e.g. Apple’s Calendar widget, then quickly from the Terminal:

ps -ax | grep .appex

To see all running app extensions. Look for the one of interest, ah there it is:

56052 ??         0:00.29 /Applications/Calendar.app/Contents/PlugIns/com.apple.iCal.CalendarNC.appex/Contents/MacOS/com.apple.iCal.CalendarNC

That’s the process ID, 56052 in this case, at the beginning of the line. Quickly click the Notification Center again to keep the process alive, and then from the Terminal:

lldb -p 56052

If all goes well you’ll attach to Apple’s Calendar app extension, where you can set a regex breakpoint on openURL calls, then resume:

(lldb) break set -r openURL
(lldb) c

Now quickly go back to the Notification Center, and click a calendar item for today. If you don’t have a calendar item for today, whoops, go to Calendar, add one, and start this whole dance over ;) Once you’ve clicked on a calendar item in Notification Center and are attached with lldb, you’ll see the tell-tale evidence:

(lldb) bt
* thread #1: tid = 0xd1a4d, 0x00007fff87f22f1f AppKit`-[NSWorkspace openURL:], queue = 'com.apple.main-thread', stop reason = breakpoint 1.8
  * frame #0: 0x00007fff87f22f1f AppKit`-[NSWorkspace openURL:]
    frame #1: 0x00007fff9213f763 CalendarUI`-[CalUIDayViewGadgetOccurrence mouseDown:] + 221
...

So Apple’s Calendar widget, at least, is not using -[NSExtension openURL:completionHandler:]. It’s using plain-old, dumb -[NSWorkspace openURL:]. And when I change my sample Today extension to use NSWorkspace instead of NSExtensionContext, everything “just works.” I suspect it will for my friend, too.

I’m guessing this is a situation where the functionality of Today extensions might be more fleshed out on iOS than on Mac, and the documentation just hasn’t caught up with reality yet. There are a lot of platform-specific caveats in the documentation, and perhaps one of them should be that, for the time being anyway, you should use NSWorkspace to open URLs from Mac-based Today extensions.
Product Packaging Oversign

For a long time I have used a custom script phase to deliberately code sign all the bundles, helper tools, frameworks, etc., that are bundled into a final shipping product. The idea behind this approach was to overcome limitations in Xcode’s built-in code signing flags, which e.g. made it difficult to be sure that subsidiary projects would be built with the same code signing identity.

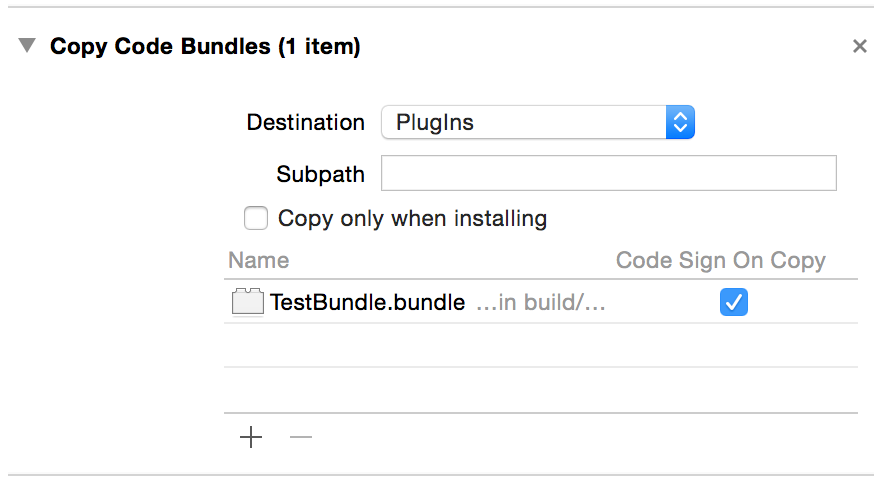
Recently I started looking at the possibility of switching to Apple’s relatively new “Code Sign On Copy” option for Copy Files build phases that involve code. For example if you’re copying files to a Frameworks, Plugins, or similarly obvious target for code resources, a friendly checkbox appears to offer code signing “as it’s copied in.”

Screenshot showing code sign on copy for copy files phase.

Xcode’s default code signing behavior gets some things right: for example, it takes care to preserve the metadata and entitlements of the original code signing, if any. This means that subsidiary product that e.g. are aware of specific sandboxing rules that should be applied to them can sign themselves as part of their build process, and the “Code Sign On Copy” action later will only update the identity associated with the code signing.

But I noticed a problem which relates to my recent obsession with script phase performance. The problem is that Xcode’s default code signing occurs too often. In fact in my projects, every single time I build, it re-signs every code object that had been copied, even though it hasn’t changed. This isn’t a big deal for one or two small frameworks, but for an app with dozens or hundreds of code objects, it becomes a noticeable time lag every time you rebuild to test a small fix.

The specific issue I discovered boils down to:

  1. Having entitlements for your target. E.g. being sandboxed.
  2. Modifying the Info.plist file in a build phase. E.g. to update the build number for the bundle.

If your target meets these criteria, then by my estimation Xcode will resign all the “Code Sign On Copy” files every time you build, regardless of whether they’ve changed. I reported this as Radar #19264472. Until Apple fixes it, the only workarounds I know are to suck it up and wait out the code signing every build, stop modifying your Info.plist, or go back to a manual code signing script that can take finer care about how and when to sign subsidiary code.

Explicit Requirement Satisfied

If you do any fine-tuned customization to your app’s code signing “designated requirement,” you may come across situations where the code appears to be signed correctly, but codesign verification nonetheless yields a cryptic, terse failure message:

./Your.app: valid on disk
./Your.app: does not satisfy its designated Requirement

This problem is pretty insidious, because the failure of an app to meet its designated requirement does not actually prevent you distributing it and having users run it. The code is still signed by you, it just doesn’t identify itself to the code signing system in such a way that it will be considered trusted by the system as being “itself.” This is bad.

How bad? The most likely to affect your users if the app uses the system keychain at all to store secure data. Even data placed in the keychain by the app itself will be denied to the app unless the user approves of the access. Worse, even if the user approves the access with “Always Allow,” the system will continue to prompt the user each and every time it tries to access the data.

The reason for the failure is that the “designated requirement” serves as a test of identity for your app. If your app doesn’t meet that test, the system assumes you no longer have any business accessing the data that you previously placed in the keychain. So an app that starts out not even meeting its own designated requirement is invalid from the start. We need our apps to meet their own designated requirements.

For most apps this is a no-brainer: just let the code signing system provide a default designated requirement. Typically, the default asserts that the bundle identifier and certificate signing chain used when signing the app are later the same. In short: unless an app is signed with the same certificate and has the same bundle ID as it had when it stored the data, it will not be allowed to access the data now.

Why customize the designated requirement? The reasons are probably too varied for me to imagine, but one common scenario that happens to affect me is one in which two different bundle IDs may effectively refer to the same “app.” For example instances of MarsEdit may possess either the “com.red-sweater.marsedit” or “com.red-sweater.marsedit.macappstore” identifiers, depending upon whether they were built for the Mac App Store or for direct sale. Another scenario where a custom designated requirement would be appropriate is if an application changed developers and either of the old developer’s and new developer’s certificate is meant to be considered legitimate. If you’re curious, poke around at the designated requirements of some of the apps on your Mac:

codesign -d -r- /Applications/Google\ Chrome.app
designated => (identifier "com.google.Chrome" or identifier "com.google.Chrome.canary") and certificate leaf = H"85cee8254216185620ddc8851c7a9fc4dfe120ef"

In this case it appears that Google wants to confirm that a very specific certificate was used to sign Chrome, but wants the pre-release “Canary” builds to be treated as authentic copies of the app, even though they have a different bundle identifier.

Customizing the designated requirement can lead to a pretty lengthy specification string that can be hard to process mentally. When such a string produces an app that doesn’t meet its own requirement, it can be hard to guess at which specific clause is failing. The codesign tool’s error message is of no help, but you can take advantage of a useful option related to the tool’s verification functionality. Pass “-R” along with a specific requirement string, and it will be evaluated separately from the designated requirement. The long and short of this is you can feed the codesign tool pieces of the larger requirement string, and see which ones pass and fail. To provide a string right on the command line, start it with an “=”:

codesign -vv -R '=identifier "com.apple.mail"' /Applications/iTunes.app 
/Applications/iTunes.app: valid on disk
/Applications/iTunes.app: satisfies its Designated Requirement
test-requirement: code failed to satisfy specified code requirement(s)

In this contrived case, we ask codesign to confirm that iTunes has Mail’s bundle identifier, and of course it fails. When we instead provide a requirement string that makes sense…

codesign -vv -R '=identifier "com.apple.iTunes"' /Applications/iTunes.app
/Applications/iTunes.app: valid on disk
/Applications/iTunes.app: satisfies its Designated Requirement
/Applications/iTunes.app: explicit requirement satisfied

…the codesign tool confirms that it passes.

In the past I have been at a loss for how to more easily debug designated requirements issues. I only discovered the “-R” option today, but I’m sure it will be a great help in the months and years to come.

Speeding Up Custom Script Phases

Some Xcode projects use a handy feature for extending the build process called a Run Script build phase. These build phases can be added to the linear list of steps that Xcode steps through when building a target, such that custom tasks such as preparing dynamically generated source code, verifying build results, etc., can call be done as part of Xcode’s standard build routine.

A problem you might run into is that a long-running script phase can be a real drag to wait through every single time you build. You can work around this problem in a few ways, depending on what makes sense for your project. Two of the simplest options are:

  1. Check the box to run the script only “when installing.”
  2. This is particularly handy if the stuff that’s happening in the build phase really doesn’t need to be there until the final release build, or if you are willing to manually perform the steps during development.

  3. Add logic to your build phase script to detect the build configuration, and either perform a more expedient version of the task, or skip it altogether. For example, a build phase that does laborious profiling of your finished product may not need to be done on “Debug” builds, so you could add a clause to the script:
    if [ ${CONFIGURATION} == Profiling ] ; then
    	echo "Running a very long profiling task!"
    	...
    	echo "Finished running a very long profiling task!"
    else
    	echo "Skipping long profiling task! Whoo!"
    fi
    

    (Note: you don’t have to use bash for your shell script phases. In fact, you can run whatever interpreter you like. I typically use Python, but used bash here as a canonical example).

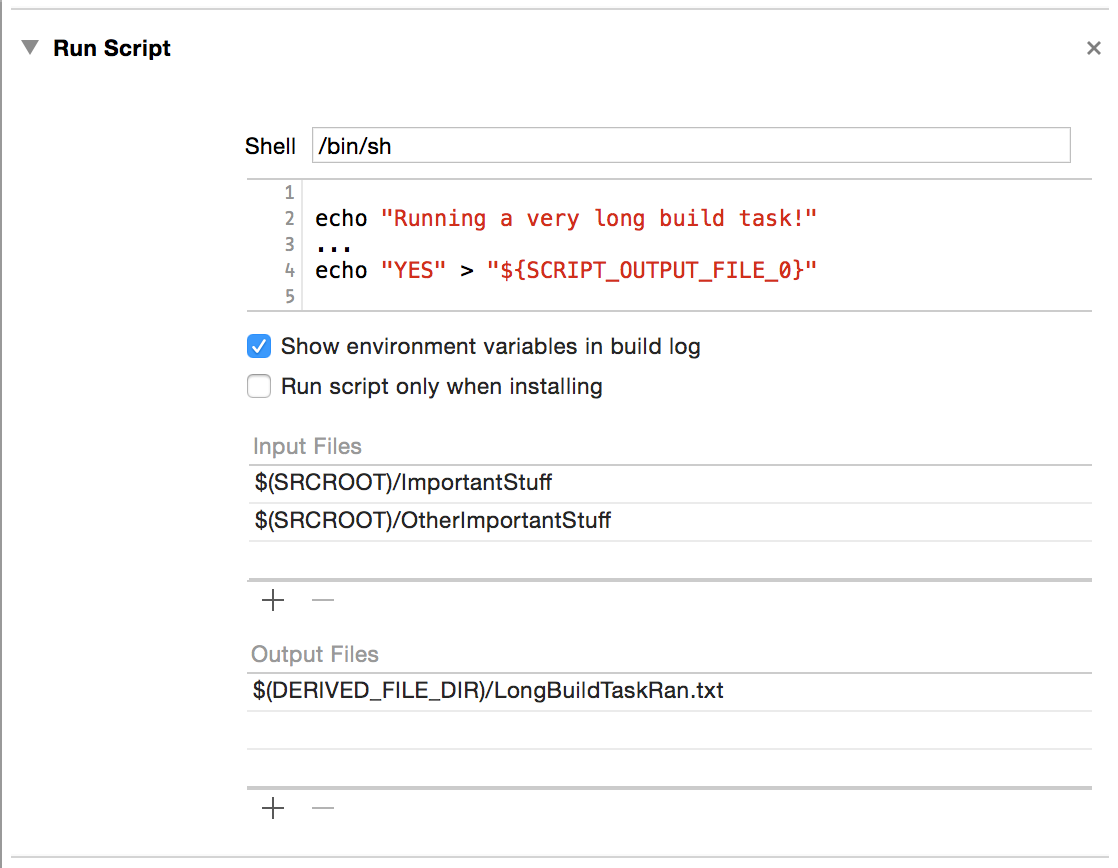
These tricks work out fine when a script phase is clearly only needed under special circumstances, but what about script phases that have to be done every time you build, rely upon files that may change over time, and take a considerable amount of time to finish? For this we can take advantage of another nuanced feature of Xcode script phases, which is the ability to specify arbitrary input and output files for the script. I think it’s time for an illustrative screenshot:

Screenshot of a configured Xcode script phase

Here’s the low down on the impact of specifying input and output files with script phases in Xcode:

  1. Lack of modification to any of the listed input files encourages Xcode not to run the script phase. Hooray! Fastness!
  2. Non-existence of any listed output file compels Xcode to run your script phase.
  3. The number of input and output file paths is passed to the script as ${SCRIPT_INPUT_FILE_COUNT} and ${SCRIPT_OUTPUT_FILE_COUNT} environment variables.
  4. Each input and output path is passed as e.g. ${SCRIPT_INPUT_FILE_0}, ${SCRIPT_OUTPUT_FILE_1}, etc.

In practice, what does this mean when you go looking to speed up your script phase? It means you should:

  1. List as an input every file or folder that may affect the results of your script phase.
  2. List at least one output, even if your script doesn’t leave any reliable artifacts.

One frustrating bug I should point out here is that Xcode (as of at least Xcode 6.0 and including 6.2 betas) is not as attentive as it should be about changes to the the input and output file lists. If you make changes to these lists, rebuild several times, and don’t see the efficiencies you expect being applied, you should close and reopen your Xcode project document. It seems to cache its notion about script phase dependencies, and will stubbornly stick to those rules until forced to re-evaluate them from scratch. I reported this to Apple as Radar #19233769.

Referring back to the screenshot above, you can that in this contrived example I have listed two input “files,” but in this case they are actually directories. This is to illustrate that if you list a directory, Xcode will trigger a re-running of your script phase whenever any shallow change occurs in that directory. For example, if I add, delete, or modify any files in ImportantStuff”, the script will run on the next build. However, if I modify a file within “ImportantStuff/Goodies”, it will not trigger the script to run because Xcode does not monitor for changes recursively.

You will also see that I’ve gone to the trouble of artificially adding a bogus file to the derived files folder, indicating the script has run. That has the effect of causing a “clean” of the project to wipe out the artificial file and thus cause the script phase to run again even though none of the input files may have changed. If I wanted to ensure that the script phase is skipped as aggressively as possible, I could provide e.g. a path to an output file that is guaranteed to exist, such as a stable file in my project like “$(SRCROOT)main.m”. Because the designation “Output File” in this case is only a hint to the Xcode build system, you don’t have to worry (and can’t expect) that the file will be created or altered unless you do so yourself in the script. This feels a little dodgy to me though, because Apple could choose to change the behavior in the future to e.g. imply that “clean” should delete all listed output files for a script phase.

Script build phases are a woefully under-documented, incredibly useful component of the Xcode build system. They are especially useful when they run blazingly fast or are skipped completely if not needed. I hope this information gives you the resources you need to take full advantage of them.

Xcode Consolation

One of the best things any Mac or iOS developer can do to improve their craft is to simply watch another developer at work in Xcode. Regardless of the number of years or the diversity of projects that make up your experience with the tool, you will undoubtedly notice a neat trick here or there that changes everything about the way you work.

If you were sitting in my office on a typical workday, looking over my shoulder, that would be a little creepy. But one thing you’d notice that differentiates me from many others is the amount of time I spend typing into the Xcode debugger console.

In my experience, other developers fall into three groups when I mention that I use the console almost exclusively when interacting with the debugger:

  1. Those who share this approach. We exchange high-fives and move on.
  2. Those who appreciate the console for occasional tricks, but rely mostly on the variables view.
  3. Those who have never heard of or noticed the console.

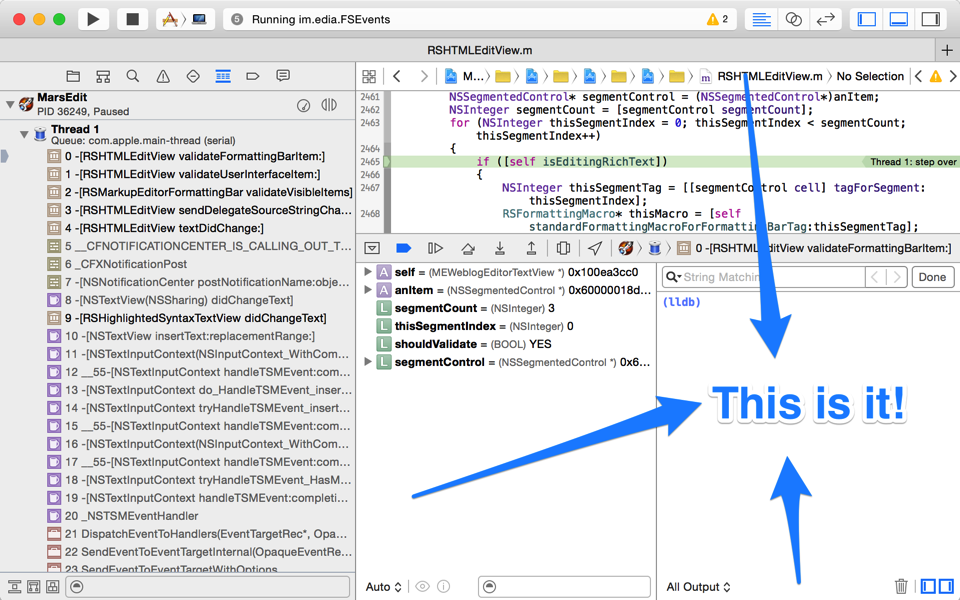
Let’s assume for the sake of argument that you fall into group 3. You can show the console while debugging any process by selecting View -> Debug Area -> Activate Console from the menu bar. In fact, I do this so often that that the keyboard shortcut, Cmd-Shift-C, is completely second-nature to me.

Xcode window with console highlighted.

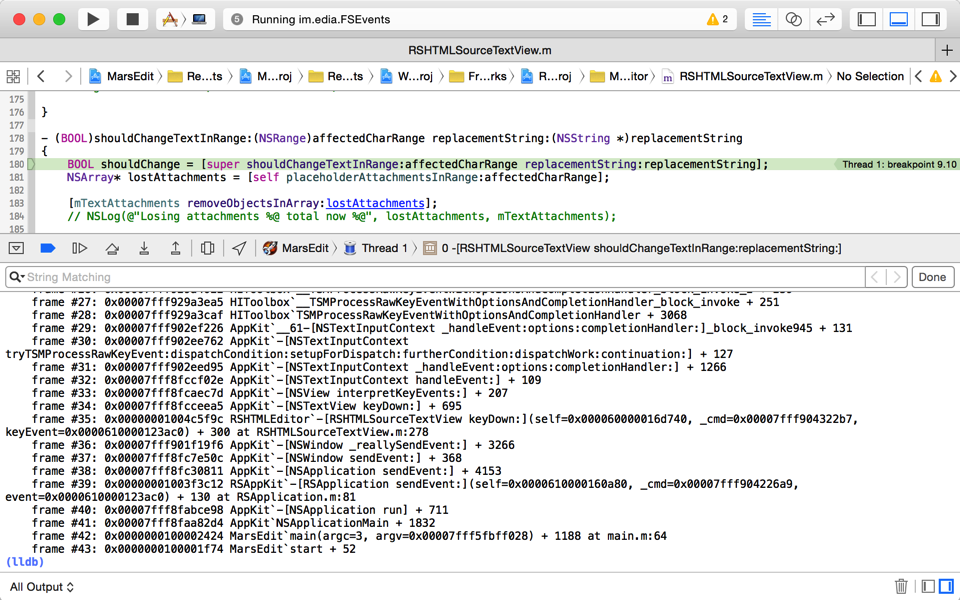
In fact I find the console so useful that it’s not unusual for me to hide much of the other junk, so I can have a mainline connection to the debugger.

Xcode window with large console area

So let’s go back again to the uncomfortable assumption that you’re sitting in my office, looking over my shoulder. What would you see me do in the console? All manner of things: For one thing I rarely click those visual buttons for stepping through code. Instead, I use these terse keyboard aliases, inherited from the bad old Gdb days. In lldb, these all come as standard abbreviations of more verbosely named commands:

  • n – step over the next line of source
  • s – step into the first line of source of a function
  • ni – step over the next instruction of assembly code
  • si – step into the first instruction of a function
  • c – continue
  • fin – continue until return from current stack frame

Those are the basics, but another trick, I believe it was called ret in Gdb, comes in handy often:

  • thread return – return immediately from the current stack frame

You could use this if you are stuck in some function that is crashed, for example, but you know that returning to the caller would allow the process to continue running as normal. Or, you could use it to completely circumvent a path of code by breaking on a function and bolting right out, optionally overriding the return value. Just to pick an absurd example with flair, let’s stub out AppKit’s +[NSColor controlTextColor]:

(lldb) b +[NSColor controlTextColor]
Breakpoint 1: where = AppKit`+[NSColor controlTextColor], address = 0x00007fff8fb05572
(lldb) break command add
Enter your debugger command(s).  Type 'DONE' to end.
> thread ret [NSColor redColor]
> c
> DONE
(lldb) c

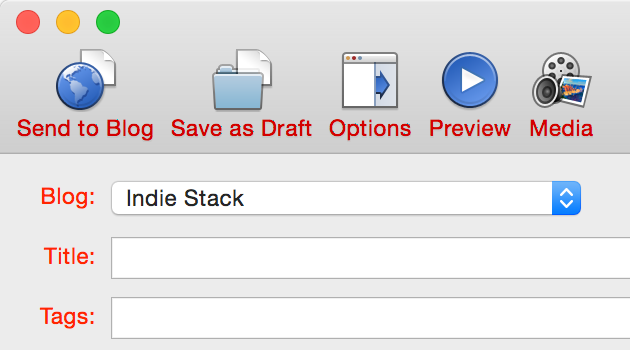
Here we have opted to break on every single call to controlTextColor, returning to the caller with a fraudulent color that is apparently not consulted by the label for this popup menu in MarsEdit:

MarsEdit screenshot with labels drawn in red

In fact, mucking about with system symbols is one of the great tricks of the console, and lldb’s built-in “breakpoint” command brings with it superpowers that can’t be touched by Xcode’s dumbed down GUI-based controls. For example, what if we wanted to set a breakpoint that would catch not only +controlTextColor, but any similar variation? Using lldb’s support for regular expression breakpoints, it’s a snap:

(lldb) break set -r control.*Color -s AppKit
Breakpoint 1: 20 locations.

Here we request that a breakpoint be set for any symbol in the AppKit framework that contains the lower-cased “control,” followed by anything, then capitalized “Color.” And lldb just set 20 breakpoints at once. To see them all, just type “breakpoint list” and you’ll see all the variations listed out as sub-breakpoints:

(lldb) break list
Current breakpoints:
1: regex = 'control.*Color', locations = 20, resolved = 20, hit count = 0
  1.1: where = AppKit`+[NSColor controlTextColor], address = 0x00007fff8fb05572, resolved, hit count = 0 
  1.2: where = AppKit`+[NSDynamicSystemColor controlTextColor], address = 0x00007fff8fb05670, resolved, hit count = 0 
  1.3: where = AppKit`+[NSColor controlBackgroundColor], address = 0x00007fff8fb1465d, resolved, hit count = 0 
  1.4: where = AppKit`+[NSDynamicSystemColor controlBackgroundColor], address = 0x00007fff8fb1475d, resolved, hit count = 0 
  (etc...)

One major shortcoming of all this goodness is Xcode has a mind of its own when it comes to which breakpoints are set on a given target. Anything you add from the lldb prompt will not register as a breakpoint in Xcode’s list, so you’ll have to continue to manipulate it through the console. You can enable or disable breakpoints precisely by specifying both the breakpoint number and its, umm, sub-number? For example to disable the breakpoint on +[NSColor controlBackgroundColor] above, just type “break disable 1.3”.

Regular expressions can be very handy for setting breakpoint precisely on a subset of related methods, but they can also be very useful for casting about widely in the vain pursuit of a clue. For example, when I’m boggled by some behavior in my app, and suspect it has to do with some system-provided API, or even an internal framework method, I’ll just throw some verbs that seem related at a breakpoint, and see what I land on. For example, it seems like some delegate, somewhere should be imposing this behavior:

(lldb) break set -r should.*:
Breakpoint 5: 735 locations.

That’s right, set a breakpoint for any ObjC method that includes the conventional “shouldBlahBlahBlah:” form in its selector name. Or if you are really at your wit’s end about an event related issue, why not capture the whole lot and see where you stand?

(lldb) break set -r [eE]vent
Breakpoint 10: 9520 locations.

Sometimes I’ll set a breakpoint like this and immediately continue, to see what I land on, but often I’ll use lldb’s breakpoint system as a quick way of searching the universe of symbol names. After setting a breakpoint like the one above, I’ll do a “break list” and then search through the results for other substrings I’m interested in. This often gives me a clue about the existence of methods or functions that are pertinent to the problem at hand.

I’ve scratched the surface here of all the powerful things you can use Xcode’s debugger console for, but I hope it has brought you some increased knowledge about the tools at your disposal. If you’ve never used the console before, or only use it occasionally, perhaps I’ve pushed you a bit farther down the path of having its Cmd-Shift-C shortcut feel like second-nature to you as well.

Reinventing AEPrintDesc

For the diminishing number of us who are still occasionally inspired or required to debug code involving AppleEvents, a lot of the head-scratching revolves around the question “what the heck is this AEDesc”?

The question is especially likely to come up when poking around in the debugger at some code you probably didn’t write, don’t have the source code for, and was not compiled with symbols of any kind. For example, you’re wondering why the heck an AppleScript behaves one way when run by your app, but another way when run in the Script Editor, or in an iWork app.

In the old days, a convenient system function could solve this problem for us: AEPrintDesc. You passed it an AEDesc, it printed out junk about it. Perfect for debugging in a command-line debugger. For example, if a pointer to an AEDesc was in register $rdi:

(lldb) expr (void) AEPrintDesc($rdi)

Unfortunately this disappeared at some point, leaving only the much less interactive AEPrintDescHandle. Not to fear, you can still make use of this from the debugger, you just have to take advantage of lldb’s ability to spontaneously generate runtime variables:

(lldb) expr void *$h = (void*)malloc(sizeof(void*))
(lldb) expr (void) AEPrintDescToHandle($rdi, &$h)
(lldb) expr *(char**)$h

But when one is head-down, debugging a serious AppleEvent issue, it’s not uncommon to need to print AEDescs left, right, up, down, and diagonally. This needs to be fast-and-furious, not daunting, slow, and error-prone. I decided to use this problem to dig into lldb’s user commands functionality. I thought at first that “command alias” would do the trick, because it shows examples of defining an alias that takes arguments from the command line and passes them along:

(lldb) command alias pdesc expr void* $h = (void*)malloc(8); (void) AEPrintDescToHandle(%1, &$h); *(char**)$h/
(lldb) pdesc $rdi
error: expected expression
error: invalid operands to binary expression ('char *' and 'unsigned long')
error: 2 errors parsing expression

The trick, as I finally learned from the lldb blog, is you have to use a special “regex” form of command if you want to properly expand arbitrary input and run whatever debugger expressions on it:

(lldb) command regex pdesc 's/(.+)/expr void* $h = (void*)malloc(8); (void) AEPrintDescToHandle(%1, &$h); *(char**)$h/'

Now when I’m stuck in the mines hammering on AEDescs, I just type “pdesc [whatever]”, and if it’s an AEDesc, I get an instantly readable result:

(lldb) pdesc $rdi
(char *) $10 = 0x00007fc3c360c0d0 "'Jons'\\'pClp'{ '----':\"file:///\", &'subj':null(), &'csig':65536 }"
(lldb) pdesc $rsi
(char *) $11 = 0x00007fc3c3626940 "'aevt'\\'ansr'{  }"

To enjoy the benefits of this command in whatever process you’re debugging, whether it’s yours, the system’s, or a 3rd-party app’s code, just add the line as-is to your ~/.lldbinit file:

command regex pdesc 's/(.+)/expr void* $h = (void*)malloc(8); (void) AEPrintDescToHandle(%1, &$h); *(char**)$h/'

Enjoy!

Update: Chris Parrish on Twitter informs me that the debugger function is still present, but it’s named differently than I remember. It’s GDBPrintAEDesc. Oh well, at least this was a good learning experience!

Update 2: Poking around a bit more in the debugger, I noticed a helpful looking function:

(lldb) expr (void) GDBPrintHelpDebuggingAppleEvents()

Run that from lldb and see a round-up of information about the GDBPrintAEDesc call and other debugging tricks provided by the AppleEvent engineers.

View Bridge Logging

One of the bits of magic associated with app extensions is that when for example a Share extension’s UI is presented in the context of host application, it behaves as though it were hooked into the UI of the app itself. Standard menu item command such as Cut, Copy, Paste, etc., are all mapped through to the extension’s UI so that standard editing commands work as expected.

But the app extension itself is actually hosted in a separate process. How does all this magic work? On the Mac at least, when the extension’s user interface is displayed, a private framework from the system called ViewBridge.framework seems to be in charge of displaying the view and coordinating communication between it and the host app.

I was trying to figure out why some specific keystrokes did not seem to be making it to my app extension, and while poking around in the debugger I noticed that the ViewBridge framework is riddled with logging messages that are, by default, largely disabled. With a little detective work I was able to figure out how to turn them on.

The long and short of it is that, Apple’s ViewBridge framework looks for an undocumented NSUserDefaults key, “ViewBridgeLogging”. The key can be used to activate, by name, any of a slew of different logging “domains,” which compel the framework to dump copious information about topics ranging from accessibility, to events, to window animations.

Two of these domains, “communications_failure” and “exceptions” are always on, so you will see console logging from these categories should the need arise. The easiest way to coax ViewBridge to dump a massive amount of information for all the other domains is to simply set the NSUserDefaults key globally from the command line:

defaults write -g ViewBridgeLogging -bool YES

Now, when you invoke and interact with your own app extension UI, you’ll see a bunch of logging messages like this:

12/2/14 11:00:30.798 AM MarsEdit Shuttle[83129]:
	<NSViewServiceMarshal: 0x7fc43af09070>
	sending key event to <NSWindow: 0x6000001ecc00>:
	NSEvent: type=FlagsChanged loc=(135,-19) time=226109.1
	flags=0x100 win=0x0 winNum=13244 ctxt=0x0 keyCode=55

This could be handy if you’re trying to work out the particulars of why or if a particular event is even reaching your extension. In fact the vast number of logging messages have often been carefully crafted to provide specific information that could be useful if you’re confused about an edge case. Here’s a more verbose one:

12/2/14 3:11:30.709 PM MarsEdit Shuttle[87440]: 
	<NSViewServiceMarshal: 0x7febfad00b30>
	choosing not to make <NSWindow: 0x6180001eea00> resign
	key because it already believes itself to lack keyness

Yet more examples of pithy prose you’ll find among the console log messages:

"activated TSM because service window became key while remote view is first responder"
"incremented TSM activation count to 1"
"told app it acquired key focus"

Even some particularly juicy language like “discarded toxic NSEvent.” Intriguing. Tell me more!

It’s worth mentioning that the ViewBridge seems to be responsible for managing more than just the UI for app extensions. For example if you leave this console logging enabled while you bring up a standard save panel from TextEdit, you’ll see a massive number of messages relating to the sandboxed file chooser’s behaviors.

It could all become pretty overwhelming, so if you want to limit the kinds of logs that make it to the system console, you can change the NSUserDefaults value from a blunt “YES” to a dictionary representation of the subset of domains you want to activate. As I said before, I believe the “exceptions” and “communications_failure” domains are always on, but to get a feel for the other domains you can selectively enable, run this from the command line:

strings - /System/Library/PrivateFrameworks/ViewBridge.framework/ViewBridge | grep kLogDomain | sort -u

These are the symbolic constant names for the strings, but the actual string values seem to be easily inferred. For example kLogDomain_Events becomes “events”. But to make things even more bullet-proof, just look closely at the messages that appear in the console in “firehose mode,” with all logging messages enabled as above. Each of the logs ends with a hashtag-style marker indicating the domain of the incident. For example, if the types of logging messages you’re interested in all end with #events or #miscellany, just change the global logging default to show only those varieties by adjusting the default like this:

default write -g ViewBridgeLogging -dict events 1 miscellany 1

Now you know a whole lot about how to learn a whole lot about what goes on when Apple’s ViewBridge framework is in charge of managing a view. Here’s hoping this makes the task of debugging particular behaviors of your app extension’s UI more palatable.