Category Archives: Worfklow

Remote Codesign Trust

It’s common to use a remote, headless build server to perform iOS or Mac builds for which the “codesign” tool must be run to sign either the resulting binary, the installer package, or both.

My friend Mitch Cohen raised a concern on our local CocoaHeads that, since 10.11.1 was released, there is a problem with such setups. The dialog that pops up when using a code signing identity for the first time ignores clicks to the “Allow” and “Always Allow” buttons:
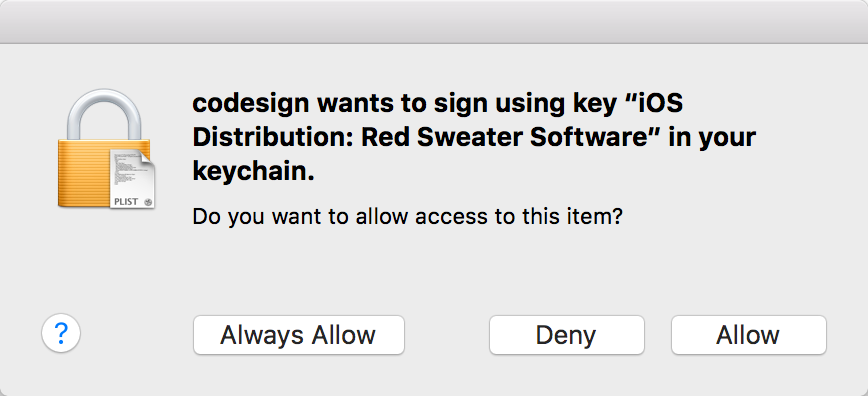
Panel prompting to allow permission to use codesign tool with private key.

If you look in the system Console, you see a line along the lines of this, correlated to each attempted click of an “Allow” button:

3/15/16 8:51:55.303 AM SecurityAgent[65532]: Ignoring user action since the dialog has received events from an untrusted source

The changes are apparently rooted in a legitimate security update made by Apple, but the end result for us developers is pretty bleak. It’s seemingly impossible to authorize use of a code signing identity on a remote server. As my friend Mitch put it, he has to call IT and “get someone to go into the data closet” every time this happens. What a drag!

I’m also affected by this issue, since I use a headless Mac Mini as a build server. Lucky for me the server is in my house, but it’s still a drag to have to go log in and control the computer with an attached keyboard.

I poked around for a solution to this problem, and found it lurking in the answers and comments of a Stack Overflow question. The basic idea is you can convince OS X to trust codesign to use the tool, just as if you had clicked the “Allow” button in that UI prompt. Here is a recipe for doing just that, logged in as a remote user over say Screen Sharing:

  1. Open Keychain Access and locate the pertinent private key. You may have to click on the “Certificates” section and then type in part of the name of the identity in question, e.g. “iPhone Distribution”:

    Screenshot of Keychain Access showing the private key

  2. Click the private key and then select File -> Export Items from the menu bar. Save the item anywhere on your server, for example the Desktop. Give it a password e.g. “hardpassword”.
  3. Now stop. Think real hard before you continue. You should have a backup of that private key somewhere. If you don’t? Don’t continue. Did you just make a backup to the Desktop? Yes, in theory. But if these are the only two copies of this private key you need to think long and hard before you continue with the next step, which I absolutely do not advise you to do.
  4. Delete the private key from your keychain. This is the scary (see above), but necessary step to get the Keychain to respect the new permissions you’re going to grant the key in a minute.
  5. Switch to the Terminal and issue a command like the following:
    security import ~/Desktop/Certificates.p12 -k ~/Library/Keychains/login.keychain -P hardpassword -t priv -T /usr/bin/codesign -T /Applications/Utilities/Keychain\ Access.app
    

    It may be important to specify the path to the specific keychain, and to belabor the point you’re importing a private key with the “-t priv” parameter. It seemed like maybe things weren’t working for me until I deigned to include these. In any case, the goal here after running this command is that the private key shown in the screenshot above should now be back in your keychain, but if you double-click it to examine its permissions, you’ll find that codesign is listed among the approved apps. If you need to provide access to other tools than codesign, list them as shown above with multiple -T parameters to the “security import” command.

In my tests that seems to address the issue. After following the recipe above carefully, I can remotely “codesign” with the specified identity to my heart’s content, without a UI prompt of any kind.

It strikes me that this trick probably shouldn’t work, at least in light of Apple’s clamping down on the ability to change authorizations through the UI of Keychain Access. So I won’t be surprised if this series of tricks doesn’t stand the test of time. For now though? No need to call IT and have them go into the data closet.

Update: Erik Schwiebert reports that Apple has addressed this problem in 10.11.4 betas:

That’s great news!

Auto Layout: Copy First, Then Edit

Here’s a possibly-too-obvious tip for folks who are adapting older iOS and Mac UI from traditional “springs and struts” to Auto Layout: always make a copy of the nib content you are working on before you start hacking away.

Because Auto Layout requires you to flip the switch for e.g. a whole window at once, and because the various adjustments to frames you make while adapting to Auto Layout may affect views in unwanted and unexpected ways, it’s extremely convenient to have at hand the UI layout as it was before surgery, so to speak.

Sure, because everybody in their right mind these days uses version control software, it’s easy enough to check out a previous iteration of a xib file and open it up for comparison, but it’s become such a certainty that I will find value in the reference, I usually just make a redundant copy in the xib itself while I’m working:

1. Select the window element in Xcode’s Interface Builder.
2. Copy and paste to make a new copy.
3. Adjust the original’s Auto Layout information until satisfied.
4. Delete the copy.

Having the reference copy is very handy as well for trying to isolate layout behaviors to just specific parts for the UI. For example, a deeply nested view seems to behave unexpectedly and you can’t get the layout right. Copy just the original from your “backup window”, and paste the view in isolation. Now see if you can get the layout right in terms of itself, without respect to the larger window. This can help you figure out the “aha!” constraint that you need to go back and add to the “real window.”

Xcode Consolation

One of the best things any Mac or iOS developer can do to improve their craft is to simply watch another developer at work in Xcode. Regardless of the number of years or the diversity of projects that make up your experience with the tool, you will undoubtedly notice a neat trick here or there that changes everything about the way you work.

If you were sitting in my office on a typical workday, looking over my shoulder, that would be a little creepy. But one thing you’d notice that differentiates me from many others is the amount of time I spend typing into the Xcode debugger console.

In my experience, other developers fall into three groups when I mention that I use the console almost exclusively when interacting with the debugger:

  1. Those who share this approach. We exchange high-fives and move on.
  2. Those who appreciate the console for occasional tricks, but rely mostly on the variables view.
  3. Those who have never heard of or noticed the console.

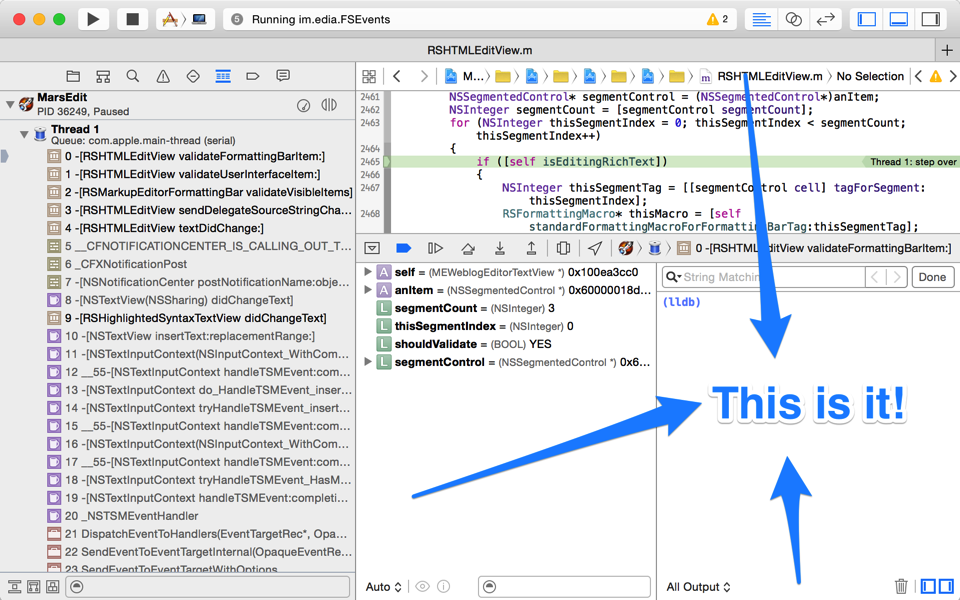
Let’s assume for the sake of argument that you fall into group 3. You can show the console while debugging any process by selecting View -> Debug Area -> Activate Console from the menu bar. In fact, I do this so often that that the keyboard shortcut, Cmd-Shift-C, is completely second-nature to me.

Xcode window with console highlighted.

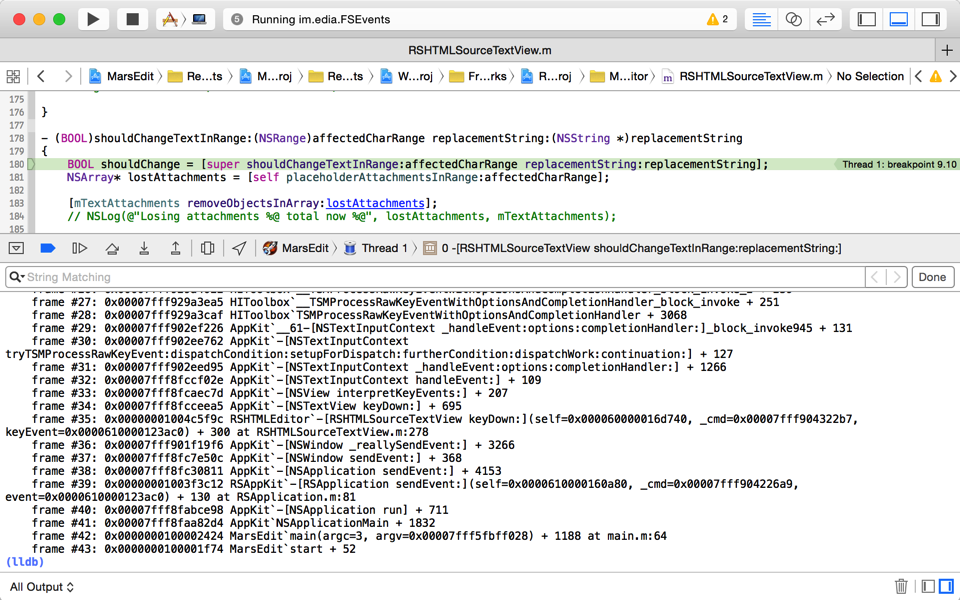
In fact I find the console so useful that it’s not unusual for me to hide much of the other junk, so I can have a mainline connection to the debugger.

Xcode window with large console area

So let’s go back again to the uncomfortable assumption that you’re sitting in my office, looking over my shoulder. What would you see me do in the console? All manner of things: For one thing I rarely click those visual buttons for stepping through code. Instead, I use these terse keyboard aliases, inherited from the bad old Gdb days. In lldb, these all come as standard abbreviations of more verbosely named commands:

  • n – step over the next line of source
  • s – step into the first line of source of a function
  • ni – step over the next instruction of assembly code
  • si – step into the first instruction of a function
  • c – continue
  • fin – continue until return from current stack frame

Those are the basics, but another trick, I believe it was called ret in Gdb, comes in handy often:

  • thread return – return immediately from the current stack frame

You could use this if you are stuck in some function that is crashed, for example, but you know that returning to the caller would allow the process to continue running as normal. Or, you could use it to completely circumvent a path of code by breaking on a function and bolting right out, optionally overriding the return value. Just to pick an absurd example with flair, let’s stub out AppKit’s +[NSColor controlTextColor]:

(lldb) b +[NSColor controlTextColor]
Breakpoint 1: where = AppKit`+[NSColor controlTextColor], address = 0x00007fff8fb05572
(lldb) break command add
Enter your debugger command(s).  Type 'DONE' to end.
> thread ret [NSColor redColor]
> c
> DONE
(lldb) c

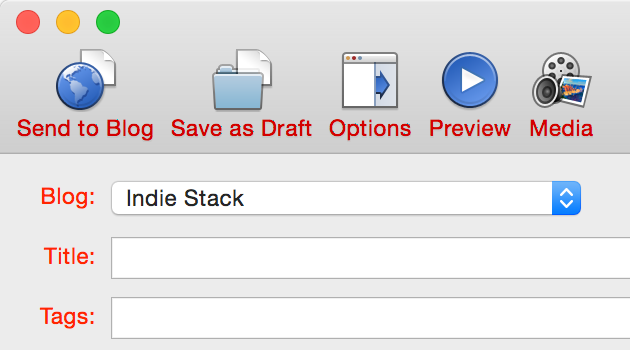
Here we have opted to break on every single call to controlTextColor, returning to the caller with a fraudulent color that is apparently not consulted by the label for this popup menu in MarsEdit:

MarsEdit screenshot with labels drawn in red

In fact, mucking about with system symbols is one of the great tricks of the console, and lldb’s built-in “breakpoint” command brings with it superpowers that can’t be touched by Xcode’s dumbed down GUI-based controls. For example, what if we wanted to set a breakpoint that would catch not only +controlTextColor, but any similar variation? Using lldb’s support for regular expression breakpoints, it’s a snap:

(lldb) break set -r control.*Color -s AppKit
Breakpoint 1: 20 locations.

Here we request that a breakpoint be set for any symbol in the AppKit framework that contains the lower-cased “control,” followed by anything, then capitalized “Color.” And lldb just set 20 breakpoints at once. To see them all, just type “breakpoint list” and you’ll see all the variations listed out as sub-breakpoints:

(lldb) break list
Current breakpoints:
1: regex = 'control.*Color', locations = 20, resolved = 20, hit count = 0
  1.1: where = AppKit`+[NSColor controlTextColor], address = 0x00007fff8fb05572, resolved, hit count = 0 
  1.2: where = AppKit`+[NSDynamicSystemColor controlTextColor], address = 0x00007fff8fb05670, resolved, hit count = 0 
  1.3: where = AppKit`+[NSColor controlBackgroundColor], address = 0x00007fff8fb1465d, resolved, hit count = 0 
  1.4: where = AppKit`+[NSDynamicSystemColor controlBackgroundColor], address = 0x00007fff8fb1475d, resolved, hit count = 0 
  (etc...)

One major shortcoming of all this goodness is Xcode has a mind of its own when it comes to which breakpoints are set on a given target. Anything you add from the lldb prompt will not register as a breakpoint in Xcode’s list, so you’ll have to continue to manipulate it through the console. You can enable or disable breakpoints precisely by specifying both the breakpoint number and its, umm, sub-number? For example to disable the breakpoint on +[NSColor controlBackgroundColor] above, just type “break disable 1.3”.

Regular expressions can be very handy for setting breakpoint precisely on a subset of related methods, but they can also be very useful for casting about widely in the vain pursuit of a clue. For example, when I’m boggled by some behavior in my app, and suspect it has to do with some system-provided API, or even an internal framework method, I’ll just throw some verbs that seem related at a breakpoint, and see what I land on. For example, it seems like some delegate, somewhere should be imposing this behavior:

(lldb) break set -r should.*:
Breakpoint 5: 735 locations.

That’s right, set a breakpoint for any ObjC method that includes the conventional “shouldBlahBlahBlah:” form in its selector name. Or if you are really at your wit’s end about an event related issue, why not capture the whole lot and see where you stand?

(lldb) break set -r [eE]vent
Breakpoint 10: 9520 locations.

Sometimes I’ll set a breakpoint like this and immediately continue, to see what I land on, but often I’ll use lldb’s breakpoint system as a quick way of searching the universe of symbol names. After setting a breakpoint like the one above, I’ll do a “break list” and then search through the results for other substrings I’m interested in. This often gives me a clue about the existence of methods or functions that are pertinent to the problem at hand.

I’ve scratched the surface here of all the powerful things you can use Xcode’s debugger console for, but I hope it has brought you some increased knowledge about the tools at your disposal. If you’ve never used the console before, or only use it occasionally, perhaps I’ve pushed you a bit farther down the path of having its Cmd-Shift-C shortcut feel like second-nature to you as well.

Reinventing AEPrintDesc

For the diminishing number of us who are still occasionally inspired or required to debug code involving AppleEvents, a lot of the head-scratching revolves around the question “what the heck is this AEDesc”?

The question is especially likely to come up when poking around in the debugger at some code you probably didn’t write, don’t have the source code for, and was not compiled with symbols of any kind. For example, you’re wondering why the heck an AppleScript behaves one way when run by your app, but another way when run in the Script Editor, or in an iWork app.

In the old days, a convenient system function could solve this problem for us: AEPrintDesc. You passed it an AEDesc, it printed out junk about it. Perfect for debugging in a command-line debugger. For example, if a pointer to an AEDesc was in register $rdi:

(lldb) expr (void) AEPrintDesc($rdi)

Unfortunately this disappeared at some point, leaving only the much less interactive AEPrintDescHandle. Not to fear, you can still make use of this from the debugger, you just have to take advantage of lldb’s ability to spontaneously generate runtime variables:

(lldb) expr void *$h = (void*)malloc(sizeof(void*))
(lldb) expr (void) AEPrintDescToHandle($rdi, &$h)
(lldb) expr *(char**)$h

But when one is head-down, debugging a serious AppleEvent issue, it’s not uncommon to need to print AEDescs left, right, up, down, and diagonally. This needs to be fast-and-furious, not daunting, slow, and error-prone. I decided to use this problem to dig into lldb’s user commands functionality. I thought at first that “command alias” would do the trick, because it shows examples of defining an alias that takes arguments from the command line and passes them along:

(lldb) command alias pdesc expr void* $h = (void*)malloc(8); (void) AEPrintDescToHandle(%1, &$h); *(char**)$h/
(lldb) pdesc $rdi
error: expected expression
error: invalid operands to binary expression ('char *' and 'unsigned long')
error: 2 errors parsing expression

The trick, as I finally learned from the lldb blog, is you have to use a special “regex” form of command if you want to properly expand arbitrary input and run whatever debugger expressions on it:

(lldb) command regex pdesc 's/(.+)/expr void* $h = (void*)malloc(8); (void) AEPrintDescToHandle(%1, &$h); *(char**)$h/'

Now when I’m stuck in the mines hammering on AEDescs, I just type “pdesc [whatever]”, and if it’s an AEDesc, I get an instantly readable result:

(lldb) pdesc $rdi
(char *) $10 = 0x00007fc3c360c0d0 "'Jons'\\'pClp'{ '----':\"file:///\", &'subj':null(), &'csig':65536 }"
(lldb) pdesc $rsi
(char *) $11 = 0x00007fc3c3626940 "'aevt'\\'ansr'{  }"

To enjoy the benefits of this command in whatever process you’re debugging, whether it’s yours, the system’s, or a 3rd-party app’s code, just add the line as-is to your ~/.lldbinit file:

command regex pdesc 's/(.+)/expr void* $h = (void*)malloc(8); (void) AEPrintDescToHandle(%1, &$h); *(char**)$h/'

Enjoy!

Update: Chris Parrish on Twitter informs me that the debugger function is still present, but it’s named differently than I remember. It’s GDBPrintAEDesc. Oh well, at least this was a good learning experience!

Update 2: Poking around a bit more in the debugger, I noticed a helpful looking function:

(lldb) expr (void) GDBPrintHelpDebuggingAppleEvents()

Run that from lldb and see a round-up of information about the GDBPrintAEDesc call and other debugging tricks provided by the AppleEvent engineers.