All posts by Daniel Jalkut

Better Swift Completion

Apple released Xcode 9 earlier this week, and in spite of a few glitches here and there, I have found the update to be an overall improvement over Xcode 8. It’s nice that Apple continues to invest in the core tools for Mac and iOS developers.

I’ve been dabbling in more and more Swift development lately, and it’s brought to light a shortcoming in Xcode’s code completion which has unfortunately not improved in Xcode 9: completion of Swift function calls when there is a large quantity of candidates.

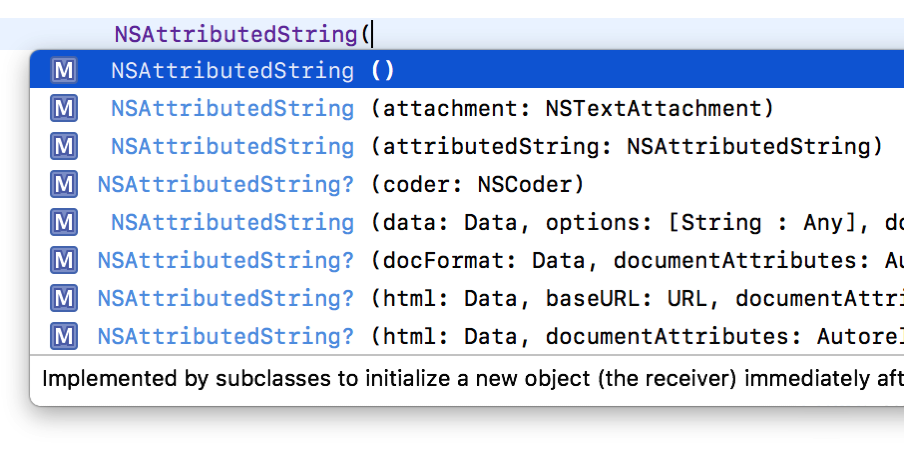
Take for example NSAttributedString. If I want to initialize a new instance in Swift, I type “NSAttributedString(” to bring up the list of compatible init methods I can choose from:

SwiftCompletion

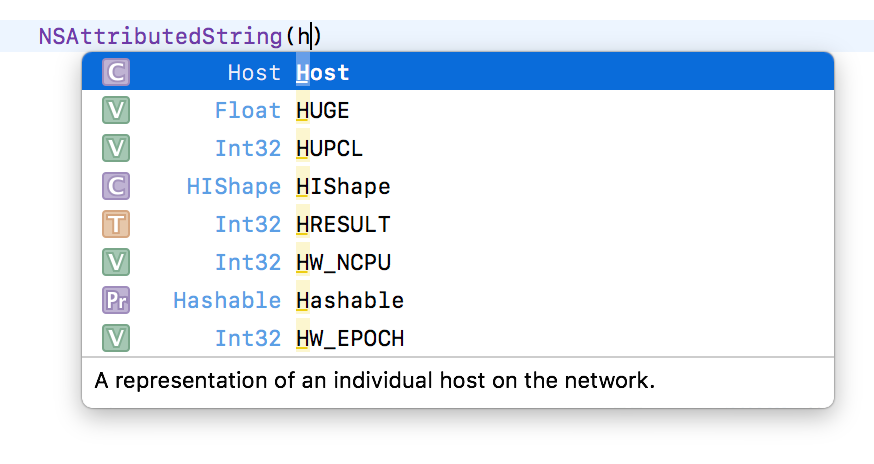
The problem at this point is that I have to navigate the menu by hand. I can’t narrow down the list of completions any further by typing, because the very next character I type will be interpreted as the manual filling out of parameters of the NSAttributedString initializer.

BadCompletion

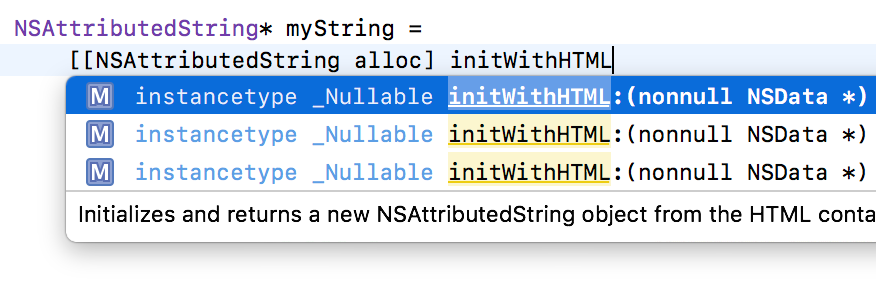
This is a situation where Objective-C gets much nicer treatment in the editor. Because completion in Objective-C begins when I start typing “init”, and because the named first parameter is part of the init message name, I can winnow down the results quite a bit:

Pasted Image 9 22 17 11 24 AM

Better still, because Xcode performs a fuzzy match on the typing, I can proceed to type the names of additional parameters to zero in completely on the variation I want:

MEAppController AppDelegate m Edited

When I accept the completion, all of my typing is replaced with the expected, templated parameter placeholders for the chose initializer.

I filed Radar #34594940 requesting better completion for Swift.

JavaScript OSA Handler Invocation

When Apple added support to macOS to support JavaScript for Automation, they did so in a way that more or less allows folks who invoke AppleScripts to invoke JavaScript for Automation scripts as if they were exactly the same. An abstraction in Apple’s Open Script Architecture (OSA) makes it easy for script-running tools to theoretically handle any number of scripting languages without concern for the implementation details of those languages.

This mostly works, but I recently received a bug report that shed light on a problem with Apple’s implementation of JavaScript with respect to invoking a specific named handler. The OSA provides a mechanism for loading and running a specific handler, or function, within a script. My app FastScripts takes advantage of this to query a script about whether it would prefer to be invoked in another process or not. Unfortunately, when it comes to JavaScript, Apple’s implementation runs the whole script in addition to running just the specific, named handler.

If you’ve got Xcode handy, you can use this simple playground content to observe the problem:

import OSAKit

if let javaScriptLanguage = OSALanguage(forName: "JavaScript") {
   let scriptSource = "Application('Safari').activate();" +
         "function boo() { ObjC.import('Cocoa'); $.NSBeep(); }"
   let myScript = OSAScript(source: scriptSource, language: javaScriptLanguage)

  // Only the behavior of boo should be observed
  myScript.executeHandler(withName: "boo", arguments: [], error: nil)
}

// Give time for the beep to sound
RunLoop.current.run(until: Date(timeIntervalSinceNow:5))

The named function “boo()” only invokes NSBeep, so when this playground is run, all that should happen is a beep should be emitted from the Mac. Instead, when it runs Safari becomes the active application. This is because in addition to running the “boo()” handler, it also runs the whole script at the top level.

A workaround to the bug is to wrap the top level functionality of a script in a “run()” handler, so where the scriptSource is declared above, instead use:

   let scriptSource = "function run() { Application('Safari').activate(); }" +
         "function boo() { ObjC.import('Cocoa'); $.NSBeep(); }"

I hope this helps the one other person on earth who cares about invoking JavaScript for Automation methods indvidually! (Radar #33962901, though I’m not holding my breath on this one!)

Xcode GitHub Integration

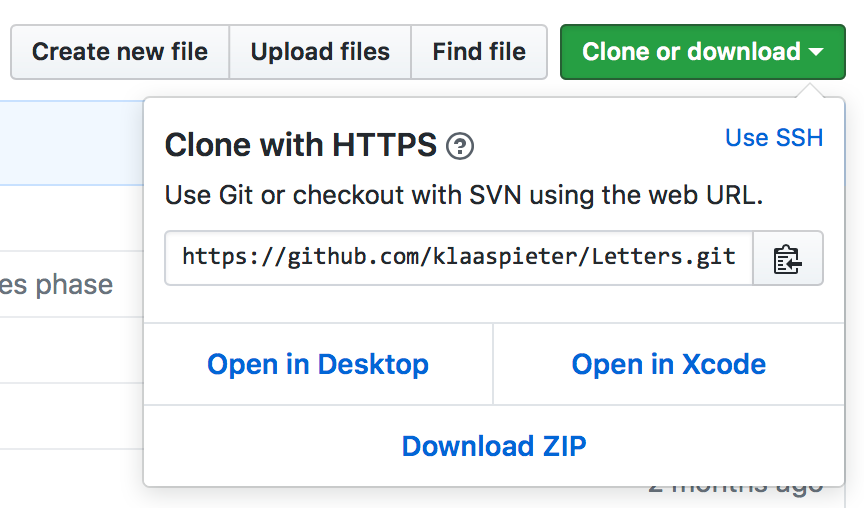
Apple’s beta release of Xcode 9 features impressive improvements to its source control features, including streamlined integration with GitHub. There’s even a fancy “Open in Xcode” button when you go to clone a project:

Screen capture of the GitHub interface for cloning a project

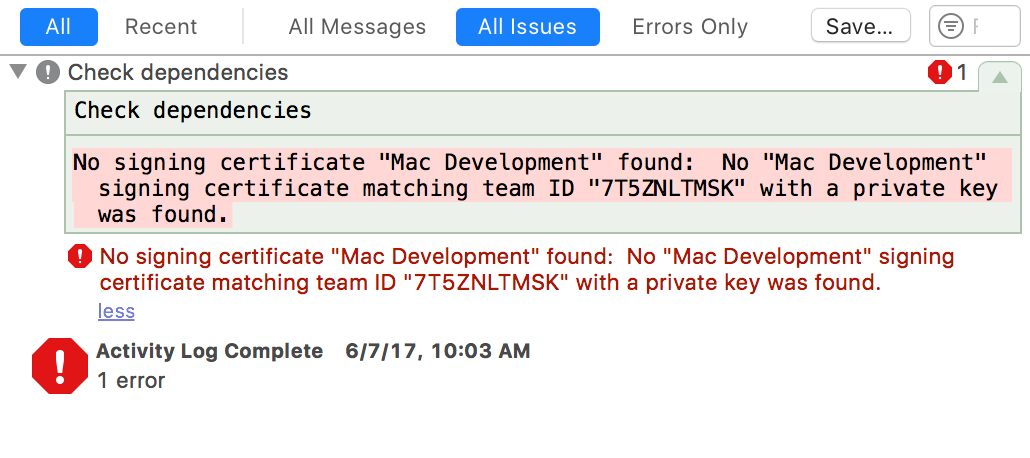
This integration is amazing. You just click the button, specify a save folder in Xcode, and boom! You’re off and …

Screen capture of build failure indicating a missing signing certificate

Oh, right. Code signing. The otherwise stellar GitHub integration in Xcode underscores a longstanding deficiency in how it manages code signing identities for multi-team, collaborative projects. Precisely the kinds of projects you’re liable to find on GitHub.

The problem could be solved, or at least diminished greatly, by providing some mechanism for declaring that a project should be code signed “with the user’s own default developer team.” The default branch of any open source project targeting Apple platforms, would specify the DEVELOPMENT_TEAM as something like:

DEVELOPMENT_TEAM = Automatic

Xcode would provide a user-level setting for “Default Development Team”, and in the absence of any overriding setting, that team would be used whenever a project was configured as above.

I wrote about this problem once before, but with all the work being put into streamlining the experience of cloning from and pushing to GitHub, now is an ideal time for Apple to embrace a fix. Radar #32614751.

Another issue that stops short the cloning, and immediate building and running, of open source projects, is the need to fulfill external dependencies. In some cases this might require manually downloading and installing libraries, or cloning projects, but in the vast majority of cases the dependencies will be specified using built-in Git submodule support, or a popular package manager. In each of these cases, it should be trivial for Xcode to detect that the project it has just cloned also has dependencies:

  • Git submodules: there is a .gitmodules directory.
  • Carthage: there is a Cartfile file.
  • CocoaPods: there is a Podfile file.
  • Swift Package Manager: there is a Swift.package file.

If Xcode sees evidence of any of these techniques at play, it could do the favor of checking them out immediately after cloning the project. Radar #32615265.

The GitHub integration coming in Xcode 9 provides a nearly effortless capability for cloning, building, and running open source projects that target Apple platforms. Ideally it would also go the extra mile and provide for variable, dynamic development teams, as well as conduct a rudimentary check for dependencies that must be checked out before commencing work on the project.

Evergreen Images

Brent Simmons, the original developer of MarsEdit and NetNewsWire, is building a new feed reader app called Evergreen:

Evergreen is an open source, productivity-style feed reader for Macs.

It’s at a very early stage – we use it, but we don’t expect other people to use it yet.

I’ve never been one to shy away from early-stage software, so of course I ran to the GitHub project page, cloned the repository, and built it immediately on my own Mac.

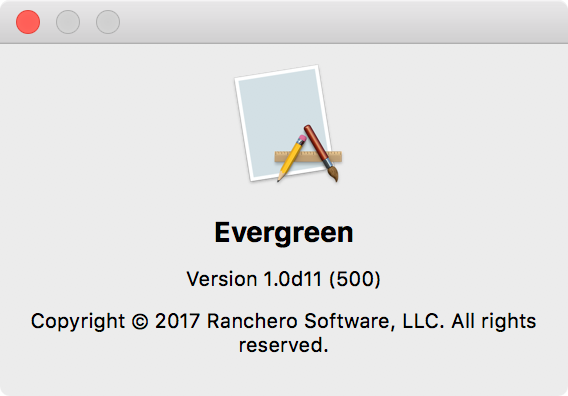
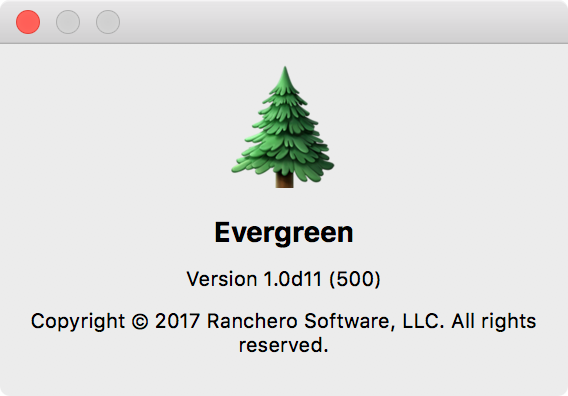
Screenshot of Evergreen about box without a custom icon.

Ahh, the tell-tale sign of a young app: the generic about box. Personally, I like to give apps-in-progress an icon, even if only a placeholder image, as soon as possible. It occurred to me that Apple has done the favor of providing a pretty-darned-suitable image for “Evergreen” in the form of its Emoji glyph of the same name:

🌲

Since I have the source code right here, why don’t I render that tree at a large size in a graphics app, resize it to a million different resolutions, bundle it up and check it in to the Evergreen source base?

Because that’s not nearly as fun as doing it in code. I dove into the Evergreen application delegate class, adding the following function:

private func evergreenImage() -> NSImage? {
	var image: NSImage? = nil
	let imageWidth = 1024
	let imageHeight = 1024
	let imageSize = NSMakeSize(CGFloat(imageWidth), CGFloat(imageHeight))

	if let drawingContext = CGContext(data: nil, width: imageWidth, height: imageHeight, bitsPerComponent: 8, bytesPerRow: 0, space: CGColorSpaceCreateDeviceRGB(), bitmapInfo: CGImageAlphaInfo.premultipliedFirst.rawValue) {

		let graphicsContext = NSGraphicsContext(cgContext: drawingContext, flipped: false)
		NSGraphicsContext.saveGraphicsState()
		NSGraphicsContext.setCurrent(graphicsContext)

		let targetRect = NSRect(origin: NSZeroPoint, size: imageSize)
		NSString(string: "🌲").draw(in: targetRect, withAttributes: [NSFontAttributeName: NSFont.systemFont(ofSize: 1000)])

		NSGraphicsContext.restoreGraphicsState()

		if let coreImage = drawingContext.makeImage() {
			image = NSImage(cgImage: coreImage, size: imageSize)
		}
	}

	return image
}

In summary this code: creates a CoreGraphics drawing context, renders a huge evergreen Emoji glyph into it, and creates an NSImage out of it.

Then from the “applicationDidFinishLaunching()” function:

if let appIconImage = evergreenImage() {
	appIconImage.setName("NSApplicationIcon")
	NSApplication.shared().applicationIconImage = appIconImage
}

Give the newly created image the canonical name, used by AppKit, for looking up the application icon, and immediately change the application’s icon image to reflect the new value. It worked a treat:

EvergreenEmoji

In programming there is usually a hard way, an easy way, and a fun way. Be sure to take the third option as often as possible.

Resolving Modern Mac Alias Files

When a user selects a file in the Mac Finder and chooses File -> Make Alias, the resulting “copy” is a kind of smart reference to the original. It is similar to a POSIX symbolic link, but whereas a symbolic link references the original by full path, an alias has historically stored additional information about the original so that it stands a chance of being resolved even if the original full path no longer exists.

An alias, for example, can usually withstand being copied from one volume to another. To test this: create a Folder in your home folder called “Test”, and a file within it called “File”. Now, make an alias to “File”. You should have a folder hierarchy that looks like this:

Test
	File
	File alias

Click on the “File Alias” item, then choose “File” -> “Show Original” from the Mac menu bar to see how it resolves to the original.

Now, copy the whole folder to another volume, for example to a thumb drive or other external drive on your Mac. Click on the alias file and “Show Original” again. Instead of resolving to the file on your home volume, it resolves relative to the location on the new volume.

That’s pretty neat.

In the old days, if a developer needed to resolve an alias file on disk, they would use a Carbon function such as FSResolveAliasFile. In recent years, particularly as Application Sandboxing was introduced on the Mac, Apple has shifted away from aliases as a developer-facing concept, towards the use of “Bookmark Data”. As a result, an “alias file” created in the Finder is no longer a traditional alias, but a blob of bookmark data. You can confirm this by examining the hex content of the “File Alias” you created above. From the Terminal:

% xxd File\ alias
00000000: 626f 6f6b 0000 0000 6d61 726b 0000 0000  book....mark....
00000010: 3800 0000 3800 0000 f003 0000 0000 0410  8...8...........
00000020: 0000 0000 0061 0000 768c 979b 7ed8 be41  .....a..v...~..A
00000030: 0000 0000 ff7f 0000 0403 0000 0400 0000  ................
00000040: 0303 0000 0004 0000 0700 0000 0101 0000  ................

It was nice of them to design the format with the tell-tale “book….mark” data right there in the header!

Although you can still use FSResolveAliasFile on these beasts, the function is deprecated and Xcode will warn you about such behavior. The way forward is to use the newer

-[NSURL URLByResolvingBookmarkData:...]

method in Objective-C, or

URL.init(resolvingBookmarkData: ...)

in Swift. Just load the NSData from the alias file’s URL, and pass it to NSURL/URL as appropriate.

There’s a big catch, however, which is that you must take care to pass the alias file’s URL as the “relativeTo:” parameter when resolving the bookmark. Otherwise the bookmark will resolve as expected in typical scenarios, but will fail to resolve in all the scenarios where bookmarks really shine, as for example in the case of moving a bookmark and its target to another volume. So, for example, to resolve an alias file you know exists at “/private/tmp/Test/SomeAlias”:

var targetURL: URL? = nil
do {
	let aliasFileURL = URL(fileURLWithPath: "/private/tmp/Test/SomeAlias")
	let thisBookmarkData = try URL.bookmarkData(withContentsOf: aliasFileURL)
	var ignoredStaleness: Bool = false
	targetURL = try URL(resolvingBookmarkData: thisBookmarkData, options: .withoutUI, relativeTo: aliasFileURL, bookmarkDataIsStale: &ignoredStaleness)
}
catch {
	print("Got error: \(error)")
}

Notice how I ignore the staleness? It’s because I think this notion of staleness is tied more to resolving data with security scope, or in any case a bookmark that you are holding as pure Data, and not one that persists as a file on disk. The safety of ignoring staleness is supported by the fact that, starting in macOS 10.10, there is a new convenience method on NSURL specifically for resolving “alias files”:

var targetURL2: URL? = nil
do {
	let aliasFileURL2 = URL(fileURLWithPath: "/private/tmp/Test/SomeAlias")
	targetURL2 = try URL(resolvingAliasFileAt: aliasFileURL2)
}
catch {
	print("Got error: \(error)")
}

Which takes care of ensuring the “relativeTo:” information is considered, on your behalf. If you don’t need to support Mac OS X 10.9 or earlier, you should use the newest method! Otherwise, I hope the information preceding is of some use.

Better GitHub Searching

Sometimes when I’m searching a GitHub repository, I end up with a ton of uninteresting results because there are, for example, tests or documentation in the repository that are not pertinent to what I’m searching for.

For example, in the Apple Swift repository, searching for “struct String” currently yields 22 results, many of which are in the “test/” subdirectory. I’m not interested in these at the moment.

To search any subpath, just modify the search with the “path:” flag: “struct String” path:/stdlib. Six results, all pertinent to the actual implementation of “struct String”. Just what I was looking for.

There are lots of fancy constraints you can apply to GitHub searches, I simply hadn’t thought to look them up until now. Maybe some of them will make your exploration easier, too.

Debugging Swift: Error in Auto-Import

Have you ever tried debugging Swift code in an embedded framework, and met resistance from lldb in the form of a cryptic AST context error?

error: in auto-import:
failed to get module 'RSAppKit' from AST context:

<module-includes>:1:9: note: in file included from <module-includes>:1:
#import "Headers/RSAppKit.h"
        ^
error: [...]/RSAppKit.h:1:9: error: 'RSAppKit/SomeHeader.h' file not found
#import <RSAppKit/SomeHeader.h>
        ^

error: could not build Objective-C module 'RSAppKit'

After hours of trying to unravel this mystery, I discovered the root cause: the framework that is embedded in my app does not, in fact, contain any headers. They were stripped by Xcode when it copied the framework into the app.

In my opinion, Xcode and/or lldb should be smart enough to handle this situation, by preferring the version of the framework in the “Built Products” directory, which still has its header files in-tact. Radar #31502879 requests this, hopefully Apple will fix it.

In the mean time, you can work around the problem by setting the REMOVE_HEADERS_FROM_EMBEDDED_BUNDLES build setting to NO in the app that embeds the framework:

Xcode build settings showing REMOVE_HEADERS_FROM_EMBEDDED_BUNDLES set to NO for DEBUG builds.

You probably want to make sure it remains set to YES for Release builds, so that you don’t ship your framework’s header files to your customers.

System Level Breakpoints in Swift

Any great software developer must inevitably become a great software debugger. Debugging consists largely of setting breakpoints, then landing on them to examine the state of an app at arbitrary points during its execution. There are roughly two kinds of breakpoints: those you set on your own code, and those you set on other people’s code.

Setting a breakpoint on your own code is simple. Just find the line of source code in your Xcode project, and tap the area in the gutter next to the pertinent line:
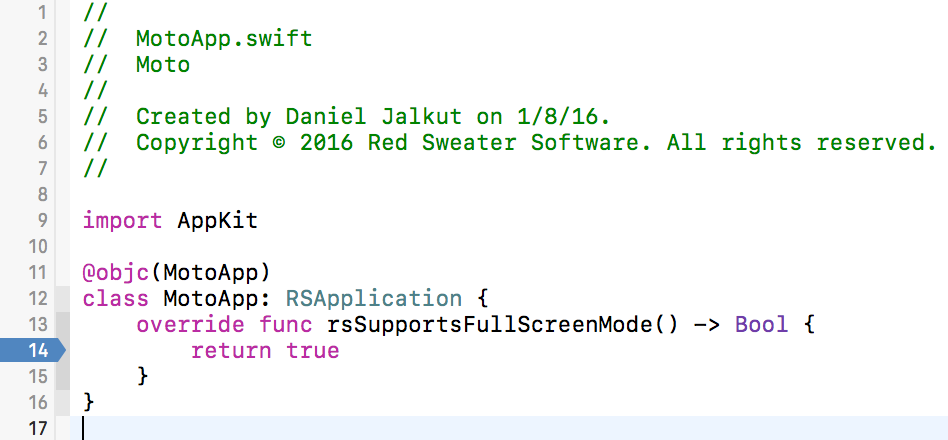
MotoAppSwift

But what if you need to set a breakpoint on a system API, or a method implemented in a drop-in library for which you don’t have source code? For example, imagine you are hunting down a layout bug and decide it might be helpful to observe any calls to Apple’s own internal layoutSubviews method on UIView. Historically, to an Objective-C programmer, this is not a huge challenge. We know the form for expressing such a method symbolically and to break on it, we just drop into Xcode’s lldb console (View -> Debug Area -> Activate Console), and set a breakpoint manually by specifying its name. The “b” shorthand command in lldb does a bit of magic regex matching to expand what we type to its full, matching name:

(lldb) b -[UIView layoutSubviews]
Breakpoint 3: where = UIKit`-[UIView(Hierarchy) layoutSubviews], address = 0x000000010c02f642
(lldb) 

If you’re intimidated by the lldb console, or you want the breakpoint to stick around longer than the current debug session, you can use Xcode’s own built-in symbolic breakpoint interface (Debug -> Breakpoints -> Create Symbolic Breakpoint) to achieve the same thing:
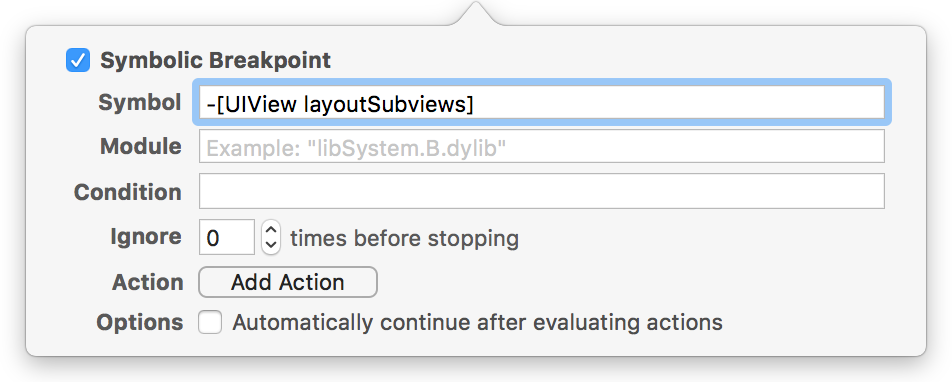
Image of Xcode's symbolic breakpoint editor

In fact, if you add this breakpoint to your iOS project and run your app, I am pretty sure you will run into a breakpoint on Apple’s layoutSubviews method. Pop back into the lldb console and examine the object that is being sent the message:

(lldb) po $arg1
<UIClassicWindow: 0x7f8e7dd06660; frame = (0 0; 414 736); userInteractionEnabled = NO; gestureRecognizers = <NSArray: 0x60000004b7c0>; layer = <UIWindowLayer: 0x600000024260>>

Now, continue and break on the symbol again. And again. Examine the target each time by typing “po $arg1” into the lldb console. You can imagine how handy it might be to perform this kind of analysis while tracking down a tricky bug.

But what about the poor Swift programmers who have come to our platforms, bright-eyed and full of enthusiasm for Swift syntax? They who have read Apple’s documentation, and for whom “-[UIView layoutSubviews]” is impossible to parse, whereas “UIView.layoutSubviews” not only looks downright obvious, but is correct for Swift?

Unfortunately, setting a breakpoint on “UIView.layoutSubviews” simply doesn’t work:

(lldb) b UIView.layoutSubviews
Breakpoint 3: no locations (pending).
WARNING:  Unable to resolve breakpoint to any actual locations.
(lldb) 

This fails because there is no Swift type named UIView implementing a method called layoutSubviews. It’s implemented entirely in Objective-C. In fact, a huge number of Objective-C methods that are exposed to Swift get compiled down to direct Objective-C message sends. If you type something like “UIView().layoutIfNeeded()” into a Swift file, and compile it, no Swift method call to layoutIfNeeded ever occurs.

This isn’t the case for all Cocoa types that are mapped into Swift. For example, imagine you wanted to break on all calls to “Data.write(to:options:)”. You might try to set a breakpoint on “Data.write” in the hopes that it works:

(lldb) b Data.write
Breakpoint 11: where = libswiftFoundation.dylib`Foundation.Data.write (to : Foundation.URL, options : __ObjC.NSData.WritingOptions) throws -> (), address = 0x00000001044edf10

And it does! How about that? Only it doesn’t, really. This will break on all calls that pass through libswiftFoundation on their way to -[NSData writeToURL:options:error:], but it won’t catch anything that calls the Objective-C implementation directly. To catch all calls to the underlying method, you need to set the breakpoint on the lower level, Objective-C method.

So, as a rule, Swift programmers who want to be advanced debuggers on iOS or Mac platforms, also need to develop an ability for mapping Swift method names back to their Objective-C equivalents. For a method like UIView.layoutSubviews, it’s a pretty direct mapping back to “-[UIView layoutSubviews]”, but for many methods it’s nowhere near as simple.

To map a Swift-mapped method name back to Objective-C, you have to appreciate that many Foundation classes are stripped of their “NS” prefix, and the effects of rewriting method signatures to accommodate Swift’s API guidelines. For example, a naive Swift programmer may not easily guess that in order to set a breakpoint on the low-level implementation for “Data.write(to:options)”, you need to add back the “NS” prefix, explicitly describe the URL parameter, and add a mysterious error parameter, which is apparently how cranky greybeards used to propagate failures in the bad old days:

(lldb) b -[NSData writeToURL:options:error:]
Breakpoint 13: where = Foundation`-[NSData(NSData) writeToURL:options:error:], address = 0x00000001018328c3

Success!

For those of you mourn the thought of having to develop this extensive knowledge of Objective-C message signatures and API conventions, I offer a little hack that will likely get you through your next challenge. If the API has been rewritten using one of these rules, it’s almost certain that the Swift name of the function is a subset of the ObjC method name. You can probably leverage the regex matching ability of lldb to zero in on the method you want to set a breakpoint on:

(lldb) break set -r Data.*write
Breakpoint 14: 107 locations.

Now type “break list” and see the massive number of likely matches lldb has presented at your feet. Among them are a number of Swift cover methods that are part of libswiftFoundation, but you’ll also find the target method in question. In fact, you’ll also see a few other low-level Objective-C methods that you may want to break on as well.

To make the list more manageable, given your knowledge that the target methods are in a given Objective-C framework, add the “-s” flag to limit matches to a specific shared library by name:

(lldb) break set -s Foundation -r Data.*write
Breakpoint 17: 8 locations.

Among these breakpoints there are a few false hits on the NSPageData class, but the list is altogether more manageable. The single breakpoint “17” has all of its matches identified by sub-numbers. Prune the list of any breakpoints that get in your way, and you’re good to go:

(lldb) break disable 17.6 17.7 17.8
3 breakpoints disabled.
(lldb) c

Apple’s mapping of Objective-C API to Swift creates an altogether more enjoyable programming experience for Swift developers, but it can lead to great confusion if you don’t understand some of the implementation details, or how to work around lack of understanding. I hope this article gives you the tools you need to debug your Swift apps, and the Objective-C code that you are unavoidably leveraging, more effectively.

Update: I filed two related bugs: Radar #31115822 requesting automatic mapping from Swift method format back to underlying Objective-C methods, and Radar #31115942 requesting that lldb be more intuitive about evaluating terse Swift method signatures.
Implicit Swift Dependencies

If you’re developing in Swift for Mac or iOS, you need to ensure that any standard Swift libraries are also copied into your app bundle. Typically this is handled automatically by Xcode when it detects the presence of any Swift files in your app. If your app is entirely Objective-C, but you link against your own frameworks that themselves depend on Swift, you have to ensure the required libraries are embedded. This can be done by setting the “Always Embed Swift Standard Libraries” checkbox in your target’s build settings to “Yes”:

AlwaysEmbed

When this option is set, Xcode scans the bundled frameworks in your app and, if any of them contains Swift code, it copies the pertinent libraries into your app’s bundle.

This approach falls down a bit when it comes to Unit Testing targets. Because a Unit Test bundle doesn’t typically copy the framework it is testing into its own bundle, Xcode seems to deduce dependencies by examining the list of frameworks the test bundle links to. If you enable the “Always Embed” option above for a Unit Testing bundle, then any framework the bundle links against will be examined for Swift code, and the required libraries copied in.

But what if none of the linked frameworks themselves require Swift, but they depend upon other frameworks that do? In projects of a substantial size, you may have higher-level frameworks implemented entirely in Objective-C, that depend upon lower level frameworks that use Swift. In this scenario, Xcode’s CopySwiftLibs build phase does not identify the deeper dependency, and neglects to embed the required Swift libraries. When your unit tests run, you’ll see a runtime error like this:

The bundle "RSTextFilteringTests" couldn’t be loaded because it is damaged or missing necessary resources. Try reinstalling the bundle.
(dlopen_preflight([...]/RSTextFilteringTests): Library not loaded: @rpath/libswiftAppKit.dylib
  Referenced from: [...]/RSAppKit.framework/Versions/A/RSAppKit
  Reason: image not found)
Program ended with exit code: 82

So “Always Embed Swift Standard Libraries” doesn’t always embed them. I’ve filed Radar #30832923, requesting that the CopySwiftLibs build phase look harder for Swift dependencies. In my opinion it should look not only at the directly linked frameworks, but at any developer-supplied frameworks that those in turn depend upon. This would cause “Always Embed” to behave as expected when a developer adds Swift dependencies to frameworks at any level of their code base.

There are many possible workarounds to the problem, and each has its own drawbacks. Here are a few:

  1. Add a Swift-based unit test file to your test bundle. This simple workaround will work in most situations, because the test itself will impose many Swift library dependencies on your bundle. There is a shortcoming, though: if the test code doesn’t generate all the Swift dependencies that your frameworks do, you’ll still be left with missing Swift libraries. For example if a dependent library requires the Swift library for Apple’s Contacts.framework, your Swift test file is not sufficient to cue Xcode to copy the required libSwiftContacts library.
  2. Manually link to Swift-dependent frameworks. Suppose your unit tests target HighLevel.framework, and LowLevel.framework depends upon Swift. By adding LowLevel.framework to the list of linked libraries for your testing bundle, you will cue Xcode to also embed the required Swift libraries for that framework. This has the advantage of ensuring that whatever Swift libraries are required get copied, but it has the drawback of requiring explicit dependency on a lower level framework from your unit test bundle.
  3. Stop! Abort mission! Revert to Objective-C only. Many Swift dabblers probably feel this emotion from time to time. The unexpected costs of adding a modest amount of Swift to a project are frustrating, and one can’t help but wonder whether they would be better off waiting until Swift support is more baked in to the system. The obvious downside of this approach is that Apple’s progress with Swift is moving quickly, and the longer you put off testing the waters, the harder it may be for you to catch up when ignoring it is no longer a viable option.

The workaround I’ve settled on for now is #2. Adding unnecessary direct dependencies to my test bundle feels a little inappropriate, but it is both easily undone in the future, and unlikely to cause any real problems in practice.

In the course of investigating this problem, it also occurred to me that unit test bundles in particular are such a special case, that Apple should probably give them special treatment to eliminate a number of pitfalls. I filed Radar #30832983 suggesting that unit test bundles should default to “Always Embed Swift Standard Libraries,” on the assumption that Swift code may be present in some library.

Thinking further on that point, it seems that Unit Tests could be safely run in an environment in which all Swift support libraries are available at runtime to be resolved by DYLD. Because test bundles are not built to be shipped to customers, it’s of primary that they link and run successfully. Such an approach would do away with the need for Unit Test bundles to either specify that Swift libraries be bundled, or to fret about which of those libraries in particular need to be copied.

Interface Builder: View Is Clipping Its Content

If you have Xcode’s “Show live issues” enabled, you’re used to seeing (usually) helpful warnings and notices about your source code and interface files. These notices appear even if you haven’t yet built your project:

Image of Xcode Interface Builder warning about a view clipping its content.

If you click the “View is clipping its content” notice, it takes you right to the view in question:

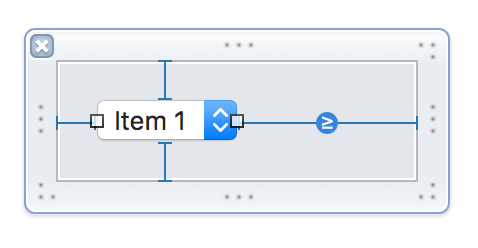
Image of a popup button on the Interface Builder canvas.

At this point you can usually just “size to fit” and Interface Builder will use its knowledge of the control’s class, and that class’s ability to size itself to suit its content. Or, if you’re using Auto Layout, it might mean that you need to ask Interface Builder to update the items’s frame, allowing Auto Layout to essentially size to fit for you.

In this case however I have a conundrum: both “size to fit” and AutoLayout insist this is the proper size and placement for the control, yet Interface Builder is still convinced the control will clip its content (the text of the menu item title).

What happens if I naively attempt to increase the width of the popup button?

Image of a popup button with error messages indicating it is the wrong width.

The clipping area is gone, as Interface Builder is convinced the button is now wide enough, but that width is in conflict with what Auto Layout is convinced is the right width.

I can’t win: if I let Auto Layout have it’s way, I get an annoying clipping notice. If I let the clipping notice have its way, Auto Layout throws a fit.

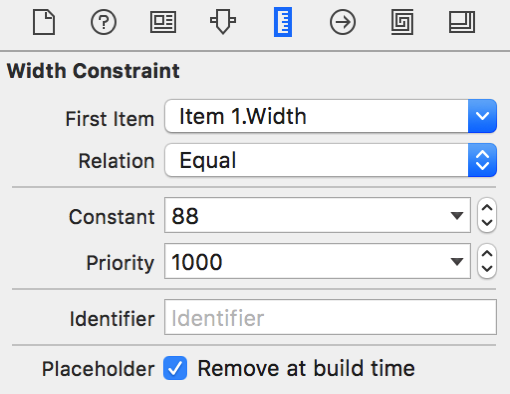
One workaround, when working with Auto Layout, is to provide a bogus constraint that forces the width of the popup button to the width that I’ve manually imposed. By setting it to “Remove at Build Time” it should not have any effect on the behavior of your interface, except in Xcode itself.

WidthConstraint

See that empty “Identifier” field? I have actually taken advantage of that field as an opportunity to add a memo to myself for future reference: “Work around bug 25938”. This references my internal bug tracking the issue, so I can re-acquaint myself with the problem if I find myself wondering about this bogus constraint in the future.

It seems to me the bug here is either that NSPopUpButton sizes to fit at too narrow a size, technically causing “clipping” of its subviews. Alternatively, Interface Builder’s deduction of a view’s size causing clipping has some bug in it. Either way, I’ve filed the issue as Radar #30222922.

Update, January 28, 2017: Thanks to a tweet from Mark Lilback, I discovered the notice about clipping is a bit less pervasive than I thought. The notice only seems to appear when Xcode has the xib file actively open for editing with Interface Builder. What this means practically is that you have to click on the xib file at some point and have the editor appear for it, before the notice appears. It also means that if you cause Xcode to close the file for editing, the notice disappears. You can close any file in Xcode by focusing on its editor and then selecting File -> “Close <filename>”, or by pressing Cmd-Ctrl-W.

I have always found these kinds of notices in Xcode to be somewhat unpredictable. The fact that the file has to be actively opened for editing, combined with the fact that files remain open in Xcode after their editor is visually swapped out, explains most of the apparent inconsistencies I’ve seen.