Category Archives: Mac

Right Storyboard, Wrong Platform

If, in haste, you inadvertently add a storyboard file to your Mac or iOS project from the wrong platform palette, you’ll end up with a storyboard that compiles and installs into the app bundle, but which products cryptic errors upon building and running. For example, a Mac storyboard lost in an iOS world:

*** Assertion failure in -[UIStoryboard initWithBundle:storyboardFileName:identifierToNibNameMap:designatedEntryPointIdentifier:], /SourceCache/UIKit_Sim/UIKit-3347.44.1/UIStoryboard.m:52

*** Terminating app due to uncaught exception 'NSInternalInconsistencyException', reason: 'Invalid parameter not satisfying: nibNameMap != nil'

The assertion above occurs when, internally to UIStoryboard, the Info.plist for your compiled “.storyboardc” file is consulted to determine its constituent “.nib” files. In the Mac case, the keys for storyboard Info.plist entries have an “NS” prefix, e.g. NSViewControllerIdentifiersToNibNames, whereas on iOS, it goes hunting for a UI-prefixed key: UIViewControllerIdentifiersToNibNames.

Granted, as soon as you proceeded to the next step, trying to populate the storyboard with UI elements that make sense for the platform, you would probably figure out your mistake. But if you’re just trying to get the ball rolling and end up immediately scratching your head over the failure, hopefully this blog post will have helped you figure out more quickly what was wrong.

I don’t think there’s any official way to change a created storyboard’s platform target. Best bet if you run into this is to delete the storyboard and recreate it from scratch, taking care to select the file template from the appropriate platform in Xcode’s “New File” panel.

Scrolling Text View Workarounds

In Creeping Text Views, I described two bugs in AppKit’s NSTextView that affect MarsEdit’s HTML text editor.

I haven’t found any bona fide solution to the problems, nor have I heard anything from Apple about whether the bug are indeed issues in AppKit or something I can alleviate through changes on my end. Hopefully these behaviors will be considered buggy and fixed by Apple for the benefit of all, but in the mean time I have come up with workarounds for each of the issues that seem to address the problems in a safe, reliable manner.

Jumping Insets: Workaround

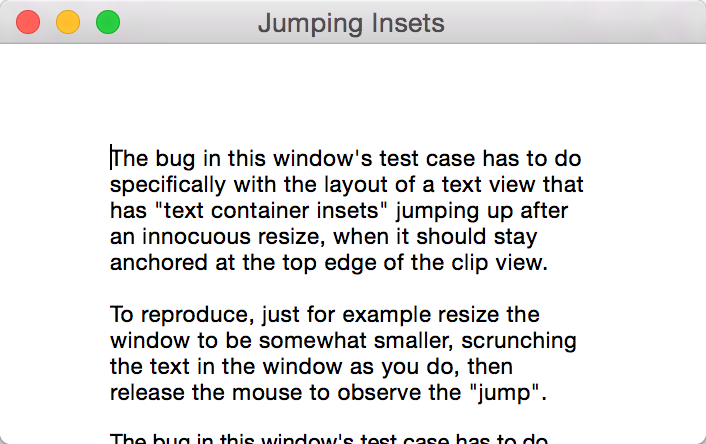
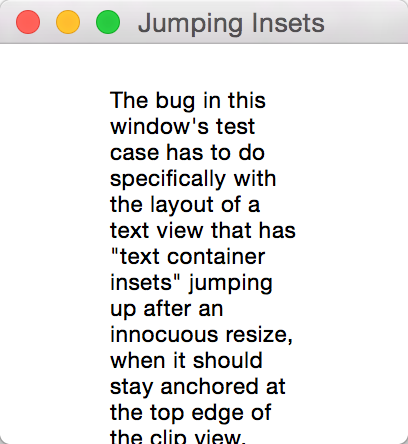
Recall that in the case of this bug, an NSTextView whose “textContainerInset” is non-zero will experience a jarring “jump” when the text view is resized such that the text becomes compressed into a smaller visible space. Thus, for the sake of making it very obvious, a text view with a large 50 point textContainerInset:

Jumping Insets

Will be scrolled after simply resizing the window, up to or equal to the amount of the inset itself:

Jumping Insets

I spent some time in the disassembler trying to figure out what causes NSTextView to impose this unwanted scroll, and finally came upon an internal method, called whenever a view finishes resizing:

- (void) _adjustedCenteredScrollRectToVisible:(NSRect)theRect forceCenter:(BOOL)forceCenter

What happens is you click to resize, you grow or shrink the window, then NSTextView recomputes the visible glyph area for the text view, and tries to scroll that specific rect to visible. The root of the bug lies in the fact that, if the computed rect is larger than the clip view then the rectangle is adjusted so that it will be centered on the clip view. This “centering” seems to be what causes the scroll view to move my content up a bit with each resize.

Why is the computed rectangle coming up bigger (taller) than the target clip view, every time? I’m not 100% sure of this, but I think what’s happening is NSTextView is using the size of the view with the textContainerInset to ask the NSLayoutManager what subset of the text should be displayed. This results in striving to display a larger amount of text than will fit in the clip view, and thus it has to be centered vertically in a compromise to fit “as much as possible.”

I observed that the problematic code path in NSTextView only seems to be reached when a live resizing ends. For example, at no time during the live resize does the content shift upwards. Through some debugging I determined that the key method that drives all of this problematic resizing is a public NSView method, documented for handling just this type of scenario: -viewDidEndLiveResize.

So, to review: NSTextView imposes a problematic scrolling of my text content, caused by its inaccurate determination of its own visible glyphs. The inaccuracy is caused by the presence a non-zero textContainerInset on the NSTextView. My workaround? Convince NSTextView, while responding to the end of live resizing, that there is in fact no textContainerInset. In my custom NSTextView subclass, I added my own implementation of -viewDidEndLiveResize:

- (void) viewDidEndLiveResize
{
	NSSize originalInset = [self textContainerInset];
	[self setTextContainerInset:NSMakeSize(0, 0)];
	[super viewDidEndLiveResize];
	[self setTextContainerInset:originalInset];
}

In my limited testing, this completely solve the problem of jumping insets, and doesn’t adversely affect layout or redrawing of the text view in any other way.

Creeping Text Views: Workaround

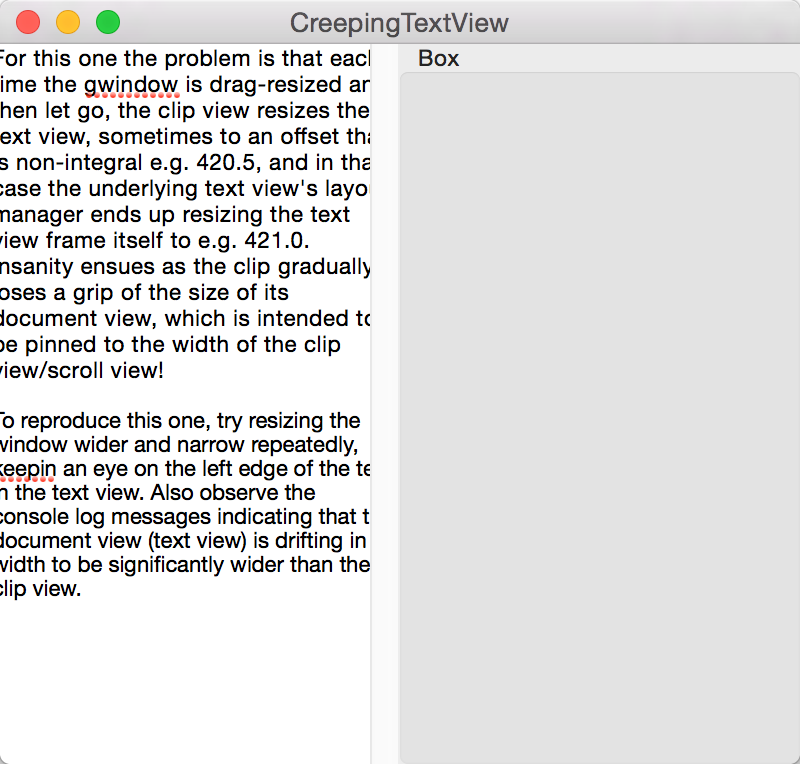
While the jumping insets bug imposes an obnoxious, unwanted vertical scroll, at least it can be easily corrected by a user: they just scroll the document back to the top. The creeping text views issue is worse because it gradually increases the width of an affect vertical placement of the scroller within a, the creeping text views issue is more insidious in that it causes a text view that is not horizontally resizable to nonetheless became dramatically wider than its clip view ordains:

CreepingTextView

For this bug, the issue boils down to a discrepancy between the frame set on an NSClipView, the frame it in turn sets on its documentView (the text view), and finally the frame that the text view itself ends up setting on itself, in order to “more accurately” accommodate the text it contains.

NSClipView imposes its own bounds on the NSTextView, but the NSTextView may, depending on the specific text content, font, and layout configuration, change those bounds to suit its needs. One common scenario in which this occurs is when the frame being set is non-integral. In this case NSTextView seems to react by rounding up to the closest integral width or height.

Non-integral dimensions used to be pretty easy to ignore, but on Retina Macs they are common-place. Thus when a 410.5 point wide NSClipView imposes its width on NSTextView, the clip view remains 410.5, but the NSTextView jumps up to 411. Once the “same width” contract is broken between these two views, it just seems to get worse and worse with every resize.

I decided to tackle this problem by limiting the clip view such that it will never be a non-integral width. Because the clip view is subservient to an NSScrollView, I know that manipulating its specific width should not affect the layout of the rest of my user interface. The NSScrollView in this scenario may still have a non-integral width, but if it is e.g. 410.5 points wide, the NSClipView within it will always be 410 points. I achieve this by using a custom NSClipView subclass, and overriding the two pertinent methods for setting the frame:

- (void) setFrameSize:(NSSize)newSize
{
	newSize.width = floorf(newSize.width);
	[super setFrameSize:newSize];
}

- (void) setFrame:(NSRect)frame
{
	frame.size.width = floorf(frame.size.width);
	[super setFrame:frame];
}

This solution feels slightly risky in that I’m interfering with the layout contract between NSScrollView and NSClipView. But in my (again, limited) tests so far I have not seen any negative side effects, and the bug is 100% addressed by including the above methods in my NSClipView subclass.

Permanent Fixes

I’m hoping that over the coming days, weeks, or months, I’ll hear something from Apple, or learn something from one of you reading this post, that will lead to a permanent fix that doesn’t require these workarounds. In the mean time, I’ll rest easier knowing my insets don’t jump and text views doen’t creep. Phew!

Creeping Text Views

My attention was recently drawn to an issue I think I’ve seen only to a relatively innocuous degree, starting in 10.10.x OS X releases: the content of MarsEdit’s HTML text editor will shift sometimes such that the origin of the text view is not placed where you would expect it to be within the surrounding scroll view.

In every case I observe the problem as a result of resizing the document window and thus resizing the text editor view.

In some cases this has the effect of simply causing the text document to “scroll down” a bit, a change that can easily be corrected by scrolling the document back up. I call this the “Jumping Insets” variant of what I assume are related issues.

In other, more troubling cases the text view’s position moves leftward while its width also expands rightward, until it is either flush with or substantially off the screen. I call this the “Creeping Text View” variant.

I have a problem with MarsEdit s document editor window having to do with Auto Layout

These are not acceptable.

I’ve spent a few days scratching my head and running experiments about these issues, and while I’ve come to a number of conclusions, none of them is completely satisfying. I know less about the “jumping insets” variant, because as I’ve found it less troubling overall, I spent more time investigating “Creeping Text Views.” Here’s what I think I know about it:

  1. The bugs only occur in the context of a Retina (@2x) screen resolution.
  2. The problem manifests as the document view (text view) at first becoming just 0.5 points wider than the clip view, and then creeping ever wider as the disconnect presumably causes the clip view’s normal sizing behavior to break down.
  3. The size discrepancy is introduced when a clip view is set to a non-integral width, and in response the NSLayoutManager associated with the text view proactively changes the frame of the text view to “more accurately” match the text.
  4. I think the problem is new to 10.10.x. OS releases.

I put together a sample project (and pre-built executable), in case you’re curious to try it. I’m curious to know if anybody has advice for how I can work around the issues systematically and in a way that doesn’t compromise my ability to take advantage of dynamic layout too much. Thoughts that have occurred to me include trying to proactively avoid non-integral view widths (hard to guarantee on Retina), and interceding in a custom NSClipView to round-down instead of up when the document view’s frame is being set to a non-integral value.

I filed these bugs together because they seem related, and because the emphasis is on “Creeping Text Views.” Radar #20487339.

Open URL From Today Extension

A friend of mine mentioned in passing that he was having trouble getting an obvious, well-documented behavior of his Today extension to work … as documented. According to Apple, a Today extension should use NSExtensionContext when it wants to open its host app, e.g. to reveal a related data item from the Today widget, in the context of the host application.

A widget doesn’t directly tell its containing app to open; instead, it uses the openURL:completionHandler: method of NSExtensionContext to tell the system to open its containing app.

They even cite one of their own apps as an example:

In some cases, it can make sense for a Today widget to request its containing app to open. For example, the Calendar widget in OS X opens Calendar when users click an event.

The idea is you should be able to use a simple line of code like this from within your Today extension. E.g., when a user clicks on a button or other element in the widget, you call:

[[self extensionContext] openURL:[NSURL URLWithString:@"marsedit://"] completionHandler:nil];

Unfortunately this doesn’t work for me, for my friend, or I’m guessing, most, if not all people who try to use it. Maybe it’s only broken on Mac OS X? I was curious, so I stepped into the NSExtensionContext openURL:completionHandler: method, and observed that it essentially tries to pass the request directly to the “extension host proxy”:

0x7fff8bd83b03:  movq   -0x15df0b7a(%rip), %rax   ; NSExtensionContext.__extensionHostProxy

But in my tests, this is always nil. At least, it’s always nil for a Today widget configured out of the box the way Xcode says it should be configured by default. So, when you call -[NSExtensionContext openURL:completionHandler:] from a Today widget on OS X, chances are it will pass the message along to … nil. The symptom here is the URL doesn’t open, your completion handler doesn’t get called. You simply get nothing.

Getting back to the fact that Apple used Calendar as their example in the documentation, I thought I’d use my debugging skills to poke around at whether they are in fact calling the same method they recommend 3rd party developers use. If you caught my Xcode Consolation post a while back, it will come as no surprise that an lldb regex breakpoint works wonders here to how the heck Apple’s extension is actually opening URLs. First, you have to catch the app extension while it’s running. It turns out Today widgets are killed pretty aggressively, so if you haven’t used it very recently, it’s liable to be gone. Click on the Today widget to see e.g. Apple’s Calendar widget, then quickly from the Terminal:

ps -ax | grep .appex

To see all running app extensions. Look for the one of interest, ah there it is:

56052 ??         0:00.29 /Applications/Calendar.app/Contents/PlugIns/com.apple.iCal.CalendarNC.appex/Contents/MacOS/com.apple.iCal.CalendarNC

That’s the process ID, 56052 in this case, at the beginning of the line. Quickly click the Notification Center again to keep the process alive, and then from the Terminal:

lldb -p 56052

If all goes well you’ll attach to Apple’s Calendar app extension, where you can set a regex breakpoint on openURL calls, then resume:

(lldb) break set -r openURL
(lldb) c

Now quickly go back to the Notification Center, and click a calendar item for today. If you don’t have a calendar item for today, whoops, go to Calendar, add one, and start this whole dance over ;) Once you’ve clicked on a calendar item in Notification Center and are attached with lldb, you’ll see the tell-tale evidence:

(lldb) bt
* thread #1: tid = 0xd1a4d, 0x00007fff87f22f1f AppKit`-[NSWorkspace openURL:], queue = 'com.apple.main-thread', stop reason = breakpoint 1.8
  * frame #0: 0x00007fff87f22f1f AppKit`-[NSWorkspace openURL:]
    frame #1: 0x00007fff9213f763 CalendarUI`-[CalUIDayViewGadgetOccurrence mouseDown:] + 221
...

So Apple’s Calendar widget, at least, is not using -[NSExtension openURL:completionHandler:]. It’s using plain-old, dumb -[NSWorkspace openURL:]. And when I change my sample Today extension to use NSWorkspace instead of NSExtensionContext, everything “just works.” I suspect it will for my friend, too.

I’m guessing this is a situation where the functionality of Today extensions might be more fleshed out on iOS than on Mac, and the documentation just hasn’t caught up with reality yet. There are a lot of platform-specific caveats in the documentation, and perhaps one of them should be that, for the time being anyway, you should use NSWorkspace to open URLs from Mac-based Today extensions.

Xcode Consolation

One of the best things any Mac or iOS developer can do to improve their craft is to simply watch another developer at work in Xcode. Regardless of the number of years or the diversity of projects that make up your experience with the tool, you will undoubtedly notice a neat trick here or there that changes everything about the way you work.

If you were sitting in my office on a typical workday, looking over my shoulder, that would be a little creepy. But one thing you’d notice that differentiates me from many others is the amount of time I spend typing into the Xcode debugger console.

In my experience, other developers fall into three groups when I mention that I use the console almost exclusively when interacting with the debugger:

  1. Those who share this approach. We exchange high-fives and move on.
  2. Those who appreciate the console for occasional tricks, but rely mostly on the variables view.
  3. Those who have never heard of or noticed the console.

Let’s assume for the sake of argument that you fall into group 3. You can show the console while debugging any process by selecting View -> Debug Area -> Activate Console from the menu bar. In fact, I do this so often that that the keyboard shortcut, Cmd-Shift-C, is completely second-nature to me.

Xcode window with console highlighted.

In fact I find the console so useful that it’s not unusual for me to hide much of the other junk, so I can have a mainline connection to the debugger.

Xcode window with large console area

So let’s go back again to the uncomfortable assumption that you’re sitting in my office, looking over my shoulder. What would you see me do in the console? All manner of things: For one thing I rarely click those visual buttons for stepping through code. Instead, I use these terse keyboard aliases, inherited from the bad old Gdb days. In lldb, these all come as standard abbreviations of more verbosely named commands:

  • n – step over the next line of source
  • s – step into the first line of source of a function
  • ni – step over the next instruction of assembly code
  • si – step into the first instruction of a function
  • c – continue
  • fin – continue until return from current stack frame

Those are the basics, but another trick, I believe it was called ret in Gdb, comes in handy often:

  • thread return – return immediately from the current stack frame

You could use this if you are stuck in some function that is crashed, for example, but you know that returning to the caller would allow the process to continue running as normal. Or, you could use it to completely circumvent a path of code by breaking on a function and bolting right out, optionally overriding the return value. Just to pick an absurd example with flair, let’s stub out AppKit’s +[NSColor controlTextColor]:

(lldb) b +[NSColor controlTextColor]
Breakpoint 1: where = AppKit`+[NSColor controlTextColor], address = 0x00007fff8fb05572
(lldb) break command add
Enter your debugger command(s).  Type 'DONE' to end.
> thread ret [NSColor redColor]
> c
> DONE
(lldb) c

Here we have opted to break on every single call to controlTextColor, returning to the caller with a fraudulent color that is apparently not consulted by the label for this popup menu in MarsEdit:

MarsEdit screenshot with labels drawn in red

In fact, mucking about with system symbols is one of the great tricks of the console, and lldb’s built-in “breakpoint” command brings with it superpowers that can’t be touched by Xcode’s dumbed down GUI-based controls. For example, what if we wanted to set a breakpoint that would catch not only +controlTextColor, but any similar variation? Using lldb’s support for regular expression breakpoints, it’s a snap:

(lldb) break set -r control.*Color -s AppKit
Breakpoint 1: 20 locations.

Here we request that a breakpoint be set for any symbol in the AppKit framework that contains the lower-cased “control,” followed by anything, then capitalized “Color.” And lldb just set 20 breakpoints at once. To see them all, just type “breakpoint list” and you’ll see all the variations listed out as sub-breakpoints:

(lldb) break list
Current breakpoints:
1: regex = 'control.*Color', locations = 20, resolved = 20, hit count = 0
  1.1: where = AppKit`+[NSColor controlTextColor], address = 0x00007fff8fb05572, resolved, hit count = 0 
  1.2: where = AppKit`+[NSDynamicSystemColor controlTextColor], address = 0x00007fff8fb05670, resolved, hit count = 0 
  1.3: where = AppKit`+[NSColor controlBackgroundColor], address = 0x00007fff8fb1465d, resolved, hit count = 0 
  1.4: where = AppKit`+[NSDynamicSystemColor controlBackgroundColor], address = 0x00007fff8fb1475d, resolved, hit count = 0 
  (etc...)

One major shortcoming of all this goodness is Xcode has a mind of its own when it comes to which breakpoints are set on a given target. Anything you add from the lldb prompt will not register as a breakpoint in Xcode’s list, so you’ll have to continue to manipulate it through the console. You can enable or disable breakpoints precisely by specifying both the breakpoint number and its, umm, sub-number? For example to disable the breakpoint on +[NSColor controlBackgroundColor] above, just type “break disable 1.3”.

Regular expressions can be very handy for setting breakpoint precisely on a subset of related methods, but they can also be very useful for casting about widely in the vain pursuit of a clue. For example, when I’m boggled by some behavior in my app, and suspect it has to do with some system-provided API, or even an internal framework method, I’ll just throw some verbs that seem related at a breakpoint, and see what I land on. For example, it seems like some delegate, somewhere should be imposing this behavior:

(lldb) break set -r should.*:
Breakpoint 5: 735 locations.

That’s right, set a breakpoint for any ObjC method that includes the conventional “shouldBlahBlahBlah:” form in its selector name. Or if you are really at your wit’s end about an event related issue, why not capture the whole lot and see where you stand?

(lldb) break set -r [eE]vent
Breakpoint 10: 9520 locations.

Sometimes I’ll set a breakpoint like this and immediately continue, to see what I land on, but often I’ll use lldb’s breakpoint system as a quick way of searching the universe of symbol names. After setting a breakpoint like the one above, I’ll do a “break list” and then search through the results for other substrings I’m interested in. This often gives me a clue about the existence of methods or functions that are pertinent to the problem at hand.

I’ve scratched the surface here of all the powerful things you can use Xcode’s debugger console for, but I hope it has brought you some increased knowledge about the tools at your disposal. If you’ve never used the console before, or only use it occasionally, perhaps I’ve pushed you a bit farther down the path of having its Cmd-Shift-C shortcut feel like second-nature to you as well.

Reinventing AEPrintDesc

For the diminishing number of us who are still occasionally inspired or required to debug code involving AppleEvents, a lot of the head-scratching revolves around the question “what the heck is this AEDesc”?

The question is especially likely to come up when poking around in the debugger at some code you probably didn’t write, don’t have the source code for, and was not compiled with symbols of any kind. For example, you’re wondering why the heck an AppleScript behaves one way when run by your app, but another way when run in the Script Editor, or in an iWork app.

In the old days, a convenient system function could solve this problem for us: AEPrintDesc. You passed it an AEDesc, it printed out junk about it. Perfect for debugging in a command-line debugger. For example, if a pointer to an AEDesc was in register $rdi:

(lldb) expr (void) AEPrintDesc($rdi)

Unfortunately this disappeared at some point, leaving only the much less interactive AEPrintDescHandle. Not to fear, you can still make use of this from the debugger, you just have to take advantage of lldb’s ability to spontaneously generate runtime variables:

(lldb) expr void *$h = (void*)malloc(sizeof(void*))
(lldb) expr (void) AEPrintDescToHandle($rdi, &$h)
(lldb) expr *(char**)$h

But when one is head-down, debugging a serious AppleEvent issue, it’s not uncommon to need to print AEDescs left, right, up, down, and diagonally. This needs to be fast-and-furious, not daunting, slow, and error-prone. I decided to use this problem to dig into lldb’s user commands functionality. I thought at first that “command alias” would do the trick, because it shows examples of defining an alias that takes arguments from the command line and passes them along:

(lldb) command alias pdesc expr void* $h = (void*)malloc(8); (void) AEPrintDescToHandle(%1, &$h); *(char**)$h/
(lldb) pdesc $rdi
error: expected expression
error: invalid operands to binary expression ('char *' and 'unsigned long')
error: 2 errors parsing expression

The trick, as I finally learned from the lldb blog, is you have to use a special “regex” form of command if you want to properly expand arbitrary input and run whatever debugger expressions on it:

(lldb) command regex pdesc 's/(.+)/expr void* $h = (void*)malloc(8); (void) AEPrintDescToHandle(%1, &$h); *(char**)$h/'

Now when I’m stuck in the mines hammering on AEDescs, I just type “pdesc [whatever]”, and if it’s an AEDesc, I get an instantly readable result:

(lldb) pdesc $rdi
(char *) $10 = 0x00007fc3c360c0d0 "'Jons'\\'pClp'{ '----':\"file:///\", &'subj':null(), &'csig':65536 }"
(lldb) pdesc $rsi
(char *) $11 = 0x00007fc3c3626940 "'aevt'\\'ansr'{  }"

To enjoy the benefits of this command in whatever process you’re debugging, whether it’s yours, the system’s, or a 3rd-party app’s code, just add the line as-is to your ~/.lldbinit file:

command regex pdesc 's/(.+)/expr void* $h = (void*)malloc(8); (void) AEPrintDescToHandle(%1, &$h); *(char**)$h/'

Enjoy!

Update: Chris Parrish on Twitter informs me that the debugger function is still present, but it’s named differently than I remember. It’s GDBPrintAEDesc. Oh well, at least this was a good learning experience!

Update 2: Poking around a bit more in the debugger, I noticed a helpful looking function:

(lldb) expr (void) GDBPrintHelpDebuggingAppleEvents()

Run that from lldb and see a round-up of information about the GDBPrintAEDesc call and other debugging tricks provided by the AppleEvent engineers.

View Bridge Logging

One of the bits of magic associated with app extensions is that when for example a Share extension’s UI is presented in the context of host application, it behaves as though it were hooked into the UI of the app itself. Standard menu item command such as Cut, Copy, Paste, etc., are all mapped through to the extension’s UI so that standard editing commands work as expected.

But the app extension itself is actually hosted in a separate process. How does all this magic work? On the Mac at least, when the extension’s user interface is displayed, a private framework from the system called ViewBridge.framework seems to be in charge of displaying the view and coordinating communication between it and the host app.

I was trying to figure out why some specific keystrokes did not seem to be making it to my app extension, and while poking around in the debugger I noticed that the ViewBridge framework is riddled with logging messages that are, by default, largely disabled. With a little detective work I was able to figure out how to turn them on.

The long and short of it is that, Apple’s ViewBridge framework looks for an undocumented NSUserDefaults key, “ViewBridgeLogging”. The key can be used to activate, by name, any of a slew of different logging “domains,” which compel the framework to dump copious information about topics ranging from accessibility, to events, to window animations.

Two of these domains, “communications_failure” and “exceptions” are always on, so you will see console logging from these categories should the need arise. The easiest way to coax ViewBridge to dump a massive amount of information for all the other domains is to simply set the NSUserDefaults key globally from the command line:

defaults write -g ViewBridgeLogging -bool YES

Now, when you invoke and interact with your own app extension UI, you’ll see a bunch of logging messages like this:

12/2/14 11:00:30.798 AM MarsEdit Shuttle[83129]:
	<NSViewServiceMarshal: 0x7fc43af09070>
	sending key event to <NSWindow: 0x6000001ecc00>:
	NSEvent: type=FlagsChanged loc=(135,-19) time=226109.1
	flags=0x100 win=0x0 winNum=13244 ctxt=0x0 keyCode=55

This could be handy if you’re trying to work out the particulars of why or if a particular event is even reaching your extension. In fact the vast number of logging messages have often been carefully crafted to provide specific information that could be useful if you’re confused about an edge case. Here’s a more verbose one:

12/2/14 3:11:30.709 PM MarsEdit Shuttle[87440]: 
	<NSViewServiceMarshal: 0x7febfad00b30>
	choosing not to make <NSWindow: 0x6180001eea00> resign
	key because it already believes itself to lack keyness

Yet more examples of pithy prose you’ll find among the console log messages:

"activated TSM because service window became key while remote view is first responder"
"incremented TSM activation count to 1"
"told app it acquired key focus"

Even some particularly juicy language like “discarded toxic NSEvent.” Intriguing. Tell me more!

It’s worth mentioning that the ViewBridge seems to be responsible for managing more than just the UI for app extensions. For example if you leave this console logging enabled while you bring up a standard save panel from TextEdit, you’ll see a massive number of messages relating to the sandboxed file chooser’s behaviors.

It could all become pretty overwhelming, so if you want to limit the kinds of logs that make it to the system console, you can change the NSUserDefaults value from a blunt “YES” to a dictionary representation of the subset of domains you want to activate. As I said before, I believe the “exceptions” and “communications_failure” domains are always on, but to get a feel for the other domains you can selectively enable, run this from the command line:

strings - /System/Library/PrivateFrameworks/ViewBridge.framework/ViewBridge | grep kLogDomain | sort -u

These are the symbolic constant names for the strings, but the actual string values seem to be easily inferred. For example kLogDomain_Events becomes “events”. But to make things even more bullet-proof, just look closely at the messages that appear in the console in “firehose mode,” with all logging messages enabled as above. Each of the logs ends with a hashtag-style marker indicating the domain of the incident. For example, if the types of logging messages you’re interested in all end with #events or #miscellany, just change the global logging default to show only those varieties by adjusting the default like this:

default write -g ViewBridgeLogging -dict events 1 miscellany 1

Now you know a whole lot about how to learn a whole lot about what goes on when Apple’s ViewBridge framework is in charge of managing a view. Here’s hoping this makes the task of debugging particular behaviors of your app extension’s UI more palatable.

Share Extension Iterations

One of the many big surprises at WWDC this year was the news that iOS 8 and Mac OS X 10.10 would support app extensions, which give developers a variety of new ways in which data and services can be shared between apps.

One of these new types of extension, called a Share extension, essentially allows apps that generate user data provide content to apps that publish user data. As a developer whose main app, MarsEdit, is a blog-publishing tool for the Mac, you can imagine how this might be of interest to me.

The first thing I noticed upon digging into app extension development is that it’s fairly fiddly to get set up, and the default build, run, invoke iteration loop is fraught with administrative overhead.

First of all, when you add a Share extension target to an existing project, you’ll discover that the new target can’t be run directly. To test or debug it, you have to invoke the Share extension from some app that supports … sharing. There are many default apps on the Mac and iOS that support sharing data of various formats. For example on Mac OS X the system Preview app makes a canonical sharing source for photo data, while the Notes app is one of many suitable test apps for sharing text. If you don’t do anything special after adding a Share extension target to your project, the auto-generated Xcode scheme will be configured to ask every time you run:

ChooseAnApp

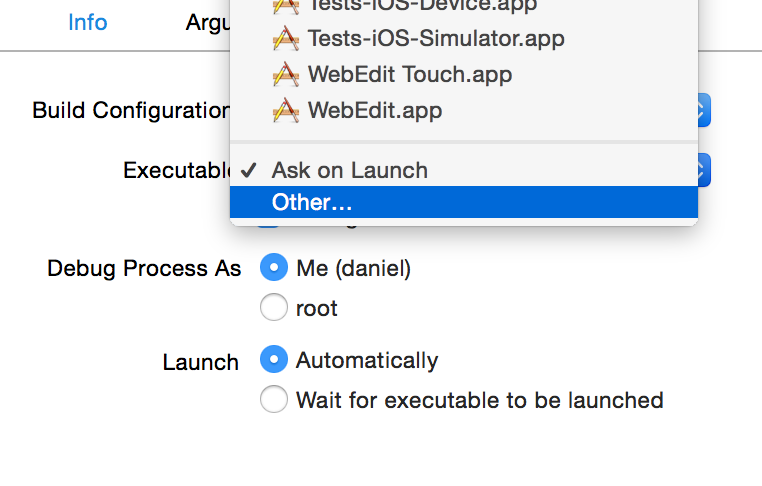
This will get old fast, and 99% of the time what you’ll want to run is exactly the same dang app you just ran. Luckily, this is easily addressed in the scheme settings, where you can change the “Executable” selection in the “Info” section of the “Run” tab from “Ask on Launch” to a specific application of your choosing.

OtherApp

That’s all well and good, but you still have to go through the tedious task of selecting some suitable content in the target app, clicking the share button, and choosing your extension from the list, before you even have the luxury of examining your own code’s behavior.

Wouldn’t it be great if you could make changes to your app extension’s appearance or behavior, click Run, and moments later be looking at your Share extension’s UI without having to do anything else? Good news: you can, and I’m about to explain how to achieve it for both Mac and iOS targets.

Automatic Invocation

The problem with all the targets on your Mac or iOS that may or may not support sharing pertinent data to your extension, is you have to walk them through the process of invoking you. When you’re deep into the development of a particular aspect of the user interface or mechanical behavior of your extension, what you really want is to repeatedly invoke the extension with the same, predictable kinds of data. Luckily, it’s possible on both Mac and iOS platforms for a host app to invoke sharing extensions programmatically, so you just need to choose a Run target that will predictably invoke your extension upon launching.

The only way I know to guarantee this is to write your own code that invokes the extension, and put it in a custom debugging-purposed target, or else put it into your main app as conditional code that only runs when building Debug variants and when prompted to take effect. I can imagine a sophisticated version of this approach involving a multi-faceted extension-debugging target that would be capable of fast-tracking extension invocation for a variety of data formats. But for the simplest solution, I recommend adding the ability to invoke your extension to the very app that hosts it. Then your simple test mode behavior will always coexist in the same source base as your extension code.

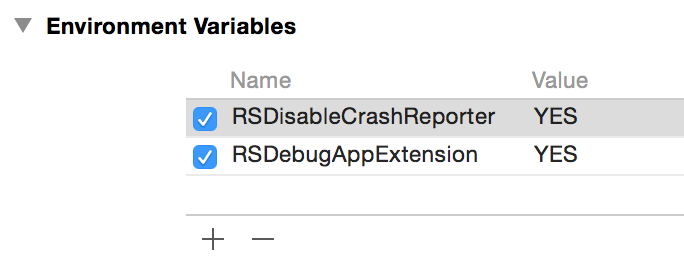
The way I approached this was to add an environment variable, “RSDebugAppExtension” to the scheme configuration for my app extension, which is also configured now to target the main app as its Executable target. So when I build and run the app extension scheme, may main app runs with these environment variables set:

Screenshot 11 24 14 3 12 PM

Now in the main app’s applicationDidFinishLaunching: method, I just have to add the appropriate code for invoking the app extension’s UI. Without the platform-specific voodoo, it looks something like this:

#if DEBUG
	// Check for flag to invoke app extension
	NSDictionary* env = [[NSProcessInfo processInfo] environment];
	NSString* appExtensionDebug = [env objectForKey:@"RSDebugAppExtension"];
	if (appExtensionDebug != nil)
	{
		// RUN MY EXTENSION
	}
#endif

The #if DEBUG just ensures that I will never inadvertenly ship this code in a release version of my app. The environment variable ensures I won’t be plagued by my extension’s UI appearing whenever I’m working on other aspects of my app besides the extension.

Now we just have to dig into the specifics of how to “RUN MY EXTENSION.” I’ll show you how that works for both Mac and iOS based Share extensions.

Invoking a Mac-based Share Extension

If you’re working on a Mac-based Share extension, the key to invoking it at runtime is to enlist the help of the NSSharingService infrastructure. You simply ask it for a service with your identifier, and ask it to “perform.”

NSString* serviceName = @"com.red-sweater.yeehaw";
NSSharingService* myService = [NSSharingService sharingServiceNamed:serviceName];
[myService performWithItems:@[@"Hello world"]];

Now when I build and run with the aforementioned environment variable set up, it pops up my Share extension, pre-populated with the text “Hello world.”

Invoking an iOS-based Share Extension

Unfortunately, iOS doesn’t support the same NSSharingService infrastructure that the Mac has. This seems like an area where we might be lucky to see more unification over the years, but for the time being the iOS notion of a sharing service is tied up with the existing “Social.framework” and its SLComposeViewController class. This is the interface that is supposed to be used to invoke a sharing panel for Facebook, Twitter, Tencent Weibo, etc. And luckily, although I don’t believe it’s documented, you can also pass in the extension identifier for your custom Share extension to instantiate a suitable view controller for hosting your extension:

NSString* serviceName = @"com.red-sweater.yeehaw";
SLComposeViewController* myController = [SLComposeViewController composeViewControllerForServiceType:serviceName];
[myController setInitialText:@"Hello World"];
[[self navigationController] presentViewController:myController animated:YES completion:nil];

You can see the basic gist of it is similar to the Mac, but you have to configure the view controller directly as opposed to providing a list of arbitrary input values. Also bear in mind that because the iOS-based solution above relies upon [self navigationController] being non-nil, you’ll need to add the special debugging code at a point in your app’s launch process when this is already set up, or else find another way of ensuring you can meaningfully present view controllers to your app’s main window.

Going Further

Notice that I hinge all the invocation on simply whether the RSDebugAppExtension environment variable is non-nil. Basically while I’m debugging I have to go in and change the code in applicationDidFinishLaunching to invoke the extension in the way I want. This works OK for me at least at this stage, but I can imagine down the road wanting to be able to fine-tune the behavior of how the extension is invoked. For this purpose, why not encode into the value of the environment variable itself certain clues about how to invoke the extension? It could specify for example what text should be passed the extension, or other configuration as desired.

My intent in sharing this blog post is both to point out some potentially time-saving tricks that will help those of you developing Share app extensions, but also to encourage you to look for creative ways to cut out the tedious aspects of whatever you work on. When all is said and done, the few monotonous steps during each iteration of work on a Share extension probably don’t add up to all that much in sheer time, but they take a lot of the joy and immediacy out of development, which frankly puts me in a bad mood. Clicking Run and seeing my work, including my latest changes, pop up instantly on the screen makes me feel a lot happier about my job.

Burn After Releasing

I am pretty diligent about following up on crash reports, probably because when it comes down to it, chasing crashes is one of the funner aspects of software development to me. Sure, when I’m hours into a frustrating problem and can’t make heads or tails of why something’s blowing up, it’s exhausting, and I wish to hell I could simply find the solution, but upon finally unwinding the riddle of a failure, it’s all those hours of toil that pay back dividends as the thrill of success.

Recently I had an odd MarsEdit crash report come in with a brief but ultimately very meaningful comment attached to it:

“I just updated a post with a PDF embedded from OneDrive.”

I love it when customers take the time to write something about the circumstances surrounding a crash. Often even a little clue can be enough to lead to the unique series of steps that will ultimately reproduce the problem. In this case though, I was confused. I know OneDrive is Microsoft’s cloud storage solution, but is the customer uploading a PDF from their mounted OneDrive, or … ?

Luckily the customer in this case also left an email address, so I got in touch and, after a few rounds of zeroing in on the meaning of the expression “embedded from OneDrive,” I learned that the issue was specifically to do with pasted HTML source code that Microsoft offers to customers who wish to literally embed a OneDrive document into another web page.

So I created a OneDrive account, added a PDF document to my storage, copied the “embed code” for the item, and pasted it into a new MarsEdit post. To my great surprise and satisfaction, when I pressed Send and published the post to my blog, MarsEdit crashed with exactly the same stack trace as the customer had submitted.

Well, I’ll be darned.

Pointing The Finger

The stack trace in this case was pretty cryptic, and implied that a private Apple class, NSURLConnectionInternal, was crashing while trying to message what I could only assume was its delegate. Here’s the gist of the very tip of the crashing thread’s trace:

Thread 0 Crashed:: Dispatch queue: com.apple.main-thread
0  libobjc.A.dylib	objc_release
1  libobjc.A.dylib	AutoreleasePoolPage::pop(void*)
2  com.apple.CFNetwork  -[NSURLConnectionInternal _withConnectionAndDelegate:onlyActive:]
3  com.apple.CFNetwork	-[NSURLConnectionInternal _withActiveConnectionAndDelegate:]

Usually, when you see something like this where a thread is crashing while trying to release an object, the first thing to suspect is that you’ve screwed something up. Probably by over-releasing some object or neglecting to nil-out a delegate attribute when one of your objects is destroyed. But in the case of logs like this where the crash occurs with a backtrace that is separate from your own code’s control (it’s a run loop callback to Apple’s own networking code), it can be hard to trace it back to specific code in your app. In this case, I can tell by the NSURL clues that a network request is probably being serviced, but which one? And which object was its delegate? Luckily, the clue about OneDrive had led me to a working test case, so I could dig into this question with more care.

The first step I like to take is to hopefully separate the crashing issue from my own app’s code, by creating a stripped-down test app that exhibits the problem. If I couldn’t achieve that, then the bug probably did rest somewhere in MarsEdit, and if I could create such a test case, then the problem of poking at it to deduce what is going wrong is made much simpler.

I created a new document based application whose document windows possess a single WebView. When a new document is created, the document does one thing: load one of those OneDrive embedded documents as the HTML content of the view. Armed with this test app, I was able to create new WebView instanced with the presumably problematic HTML code, and observe the behavior of each WebView in isolation from other junk that might have been going on in a more complex app such as MarsEdit.

The only problem was that my test app didn’t seem to exhibit any problems. I could load 10, 20 WebViews with the OneDrive embed code in it, and they all ran like butter. Damn it, there was no bug here! Until, that is, I deigned to close one of those windows. Blam! The test app crashes, yielding an identical stack trace to the one provided by my customer and reproduced in MarsEdit.

It started to make sense: when you publish a post from MarsEdit, the default setting is to also then close the window associated with that post. The reason the customer experienced the crash after sending the post to their blog was only because that happened to correlate with MarsEdit subsequently closing the window, and thus destroying the WebView that had held the OneDrive embed content.

Whose Zombie Is This?

Armed with a simple test case that reproduces the bug at will, the first thing I did was to enable Apple’s built-in facility for debugging so-called “zombie” objects. These are perfectly named because they are objects that have been deallocated but which some code within your app treats as though they were still alive. When you message a zombie object, the behavior is unpredictable because all the data that had been associated with the object is now correlated with whatever other use the system has found for that area of memory. Xcode has a convenient checkbox that makes it easy to turn on zombie detection. Just open the scheme editor and look for the Diagnostics tab under the Run configuration:
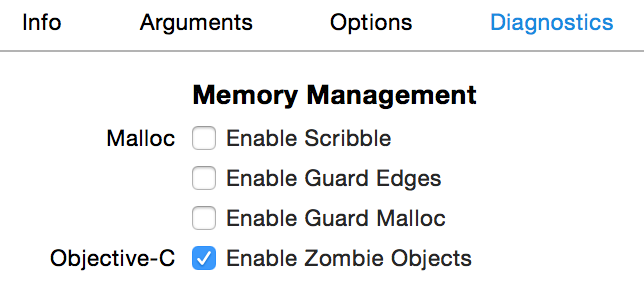
Screenshot 11 6 14 5 25 PM

This option instructs the Objective-C runtime to abstain from completely deallocating objects. In doing so, it transforms deallocated objects into a special kind of placeholder object that can detect when it has been messaged, and scream to high hell about it. When I run with zombie objects enabled, and reproduce the crash, I also see this message in the console log:

*** -[WebView release]: message sent to deallocated instance 0x6080001273a0

Ah ha! So the object in question, the one being delegated to by NSURLConnection, is probably the instance of the WebView itself. But, I don’t set a WebView as a delegate of any NSURLConnection, and certainly this simplified test case doesn’t. So it must be WebKit itself that is setting itself as an NSURLConnection’s delegate. Not my problem, I can file the bug and move on … or can I?

Going The Extra Mile

This is where the open-sourced nature of WebKit is both a blessing and a curse. If this issue had been revealed to exist somewhere deep within AppKit, or any of Apple’s other closed-source frameworks, I most certainly would have thrown up my arms, filed a bug, and hoped for the best. But Apple’s WebKit framework is something I can download, build, and debug. Sure, it takes nearly all day to build, and there is a steep learning curve to debugging it, but why did I become a software developer if I’m not up for a challenge?

Since I knew that the issue at its core appeared to be the over-release of an object, specifically of the WebView, I moved up from the basic utility of zombie objects to the high-octane “Zombies” flavored analysis configuration of Apple’s Instruments tool. Like the runtime flag we set earlier in Xcode, this makes it easy to detect attempts to message zombie objects, but it also goes a step further by correlating that knowledge with a recorded history of a given object, and all the memory-management related manipulations of that object.

Simpler

The tail end of a very long table shows the running retain count for an object, in this case the WebView itself, as well information about which library, method, or function was responsible for the call that affected the object’s memory management status.

To make a long, long, long, long, story very short: I used Instruments and its “pairing” functionality, which lets you hide balanced pairs of retain/release calls so that you are left with a more manageable subset of calls to examine and scrutinize. After scratching my head over this for hours and not making much headway, I finally came upon a specific call stack that had a very suspicious heritage. I confirmed through Instruments and then by direct examination of WebKit source code, that the WebView instance in question was in fact retaining and then autoreleasing itself as part of its dealloc method.

In this era of ARC, some of you may not be so intricately familiar with Cocoa memory management to see at a glance why that’s a very bad thing. Here it is a nutshell:

  1. By the time an object’s dealloc method is done running, the object is gone. I mean, literally gone, or else being managed as a zombie object for debugging purposes.
  2. An object can be retained and released as much as you like, but if you’re already in the midst of dealloc’ing the object, it won’t make a bit of difference.
  3. Autoreleasing an object postpones release until a later time, when the active autorelease pool is released.
  4. Thus, autoreleasing an object in the midst of being dealloc’d guarantees that it will later be sent a release message. Oops, that would be bad. It could even cause a crash like the one we’re seeing…

How in the heck does WebView manage to autorelease itself as a consequence of dealloc’ing itself? And what unique relationship does that possibility have to the embedding of Microsoft OneDrive documents? I’ll try to be as brief as possible:

Microsoft’s OneDrive support installs JavaScript callbacks that run on a periodic basis, constantly fetching data from Microsoft’s servers via xmlHTTPRequest. The calls are made with such frequency that, especially while an embedded document is in the process of loading, there’s a good chance that closing a WebView and dealloc’ing it will catch Microsoft at a time when it thinks sending such a request is a good idea. The process of cleaning up the WebView has a side-effect of cleaning up the JavaScript runtime environment, and callbacks such as Microsoft’s might get one last chance to send a network request.

Sending the request would be fine, except for WebView’s own conscientious behavior which takes care to retain and autorelease itself whenever a new batch of network requests is made on its behalf. This guarantees that the WebView won’t disappear while an open request is running. But of course, it can’t make that guarantee when the WebView is in the process of being destroyed.

Short story shorter: WebView inadvertently adds itself to the autorelease pool when it’s on the verge of being destroyed, and subsequent release of that autorelease pool causes a zombie message to be sent to the deallocated instance.

I reported the bug, and submitted a patch to the WebKit team. My proposed fix works around the problem by wrapping the bulk of WebView’s -dealloc method with a separate autorelease pool, such that any inadvertent autoreleasing of the WebView will be tidied up before the object is literally destroyed. Because WebKit is open source, I was able to make the change, build and test it, and confirm that the crashes disappear both in my test app and in MarsEdit.

I would like to thank Alexey Proskuryakov for taking the time to help dig into the issue in parallel with me. He was on to the nut of the problem long before I was, but I glossed over some key hints in his analysis. He also helped in guiding me through the steps of submitting a proper patch with my bug report.

In The Mean Time

Hopefully Apple will accept my patch, or come up with a smarter way of fixing the problem for a future update to WebKit. In the mean time, I want my app to be as reliable as possible for the widest variety of users as possible. Yes, that even means Microsoft OneDrive users. How can I work around the problem today?

The simplest solution, requiring neither subclassing of WebView, swizzling, or anything like that, is simply to take care before releasing a WebView in your app, to manually call -[WebView close] on it first. This takes care of all the complicated business that runs the risk of autoreleasing the WebView, such that when WebView’s own dealloc method is reached, it won’t have any such complexities to expose itself to.

Tracking down and fixing this bug has been an incredibly tiresome yet rewarding experience. I hope you have learned a thing or two from the approach I took here, and that I have inspired you to take crash reports with the seriousness they deserve. Your customers will thank you for it, and you might even get a kick out of occasionally coming out on top!
Yosemite’s Dark Mode

If you’re a Mac developer you’re no doubt feeling that restlessness that comes when a major new OS release is nigh. Mac OS X 10.10 Yosemite has been cycling through “GM Candidate” releases for the past couple weeks, and many people seem to think it’s likely to be released to the public later this month.

One of the big user-facing visual changes is an optional “dark mode,” accessible from the General tab of System Preferences. When a user ticks this on, high level UI elements such as the menu bar and dock adopt a different style of drawing which you can roughly characterize as being white-on-black instead of the default black-on-white Mac appearance.

One hiccup for developers of third party apps is if you have an NSStatusItem or other custom menu bar item with a custom icon, you probably designed it so that it looks good on the white or light default menu bar.

Unfortunately, Apple has not provided a sanctioned method for detecting whether the user has switched to “dark mode,” so it’s non-trivial to tune your art to suit each of the modes at runtime. Instead, Apple recommends that all such icons should be designed such that Apple can effectively color them as appropriate for the current mode.

Luckily it’s pretty easy to get this behavior for custom status bar icons. You probably already call -[NSStatusItem setIcon:yourImage] with your custom image. Now, just make sure to call -[yourImage setTemplate:YES], and you’re done. The only caveat I would add here is that Mac OS X 10.9 and earlier do not seem to respect the “template” attribute when drawing status items, so I think the safest bet is to check for 10.10 at runtime, and omit the call to setTemplate if you’re running any earlier system:

BOOL oldBusted = (floor(NSAppKitVersionNumber) <= NSAppKitVersionNumber10_9)
if (!oldBusted)
{
	// 10.10 or higher, so setTemplate: is safe
	[myIcon setTemplate:YES]
}

Now your status item icon looks great on 10.10, where in fact its coloring may even be slightly altered in light mode, and in 10.9, where it looks, well, like it always did. Update: thanks to Rick Fillion and Will Cosgrove for explaining that my problems on 10.9 are probably because my image is not designed right for use as a template. I’ll leave the solution to that as an exercise for the writer.

Unfortunately, this promise does not hold true for regular NSMenuItem items that are installed at the highest level in the menu bar. These are relatively uncommon, but for example you might find some apps with a gear icon, a script icon, or other similar graphic in lieu of a text-based menu title. When an icon is supplied to such a menu item, the template nature is not meaningfully respected in dark mode, so the icon draws more or less as-is, and is likely to almost disappear because of the lack of contrast. If you happen to be running 10.10 you can witness this problem by running iTunes and seeing that at least one script is in ~/Library/iTunes/Scripts. Its script menu icon appears right next to the “Help” menu.

I reported the issue to Apple and it came back as a duplicate. As of the latest 10.10 GM candidate, it has not been fixed, but I got a reassuring tweet from Apple’s own Eric Schlegel today:

So in summary, if you use icons as the “titles” of menus either inside or outside of the status bar area of the menu bar, be sure to call setTemplate:YES on it when running on 10.10. If you happen to have a menu bar icon affected by the bug I reported, I recommend creating a test project that installs an NSStatusItem with the same icon, so you can get a sense for how it’s going to look in dark mode when its template nature is suitably handled.