Category Archives: Debugging

Xcode’s Environmental Pollution

For a while now my build server has been issuing a large number of mysterious but important sounding warnings along these lines:

warning: include location '/usr/local/include' is unsafe for cross-compilation [-Wpoison-system-directories]

I’m allergic to warnings, and tend to abide by a 100% no-warnings-allowed policy, at least when it comes to release builds. So it was important to me to track this down and finally silence it.

I was really scratching my head because I don’t specify this include location anywhere in my build commands. Normally when an issue like this comes up, it’s easy enough to debug the problem by copying the build command out of the build log and pasting it into the Terminal. Invoking it independently of the xcodebuild process usually reproduces the same warning, and gives you the specific combination of command line options that is leading to the warning being generated.

In this case however, copying and pasting the command line to the Terminal did not yield the warning. What’s going on?

I figured I would take a step back and just try to reproduce the problem independently from my build scripts. Instead of copying and pasting the specific “clang” invocation that yields the warning, I’ll copy and paste the “xcodebuild” line instead. Bzzt! Still no warning.

After a lot of trial and error, I came across the strangest observation: if I invoke “xcodebuild” from within my Python-based build script, the warning is emitted. If I invoke it directly from the Terminal, it isn’t. In fact, if I simplify my build script to simply invoking “xcodebuild”, the warning happens. Stranger still? If I change the script from “python3” to just “python”, the warning goes away again.

I strongly suspected that the difference in behavior must be based in environment variables, so I decided to add a line to the top of the python script:

import os; print(os.environ)

Sure enough, the environment variables differed when I ran the script with “python” vs. “python3”. To get a feel on your own Mac for how the two commands differ, you could run this as a one-liner with python and with python3:

python3 -c "import os; print(os.environ)"

If your configuration is like mine, the output will include a “CPATH” value something like this:

{... 'CPATH': '/usr/local/include', 'LIBRARY_PATH': '/usr/local/lib'}

That “CPATH” entry for example only exists when invoking the script with python3, and it’s this very environment variable that is creating the unexpected Xcode warnings!

I was perplexed about how or why the version of Python could impact these environment variables, but then I remembered that python3 is bundled in Xcode itself, and the version at /usr/bin/python3 is a special kind of shim binary that directs Apple to locate and run the Xcode-bundled version of the tool. Apparently, a side-effect of this mechanism causes the problematic environment variable to be set! Running the python3 implementation directly where it lives in the Xcode installation:

`xcrun -f python3` -c "import os; print(os.environ);"

Does not exhibit the problematic environment variable!

So the issue is not about running python vs. python3 per se, but about invoking an Xcode build via any mechanism that leads to Apple’s “relocation” shim being executed and inadvertently mucking with environment variables that will impact the build process. I’ve filed FB9776086 requesting that the unwanted environment variables not be set when invoking commands, but in lieu of a system-wide fix, I’ll be adding this to the top of my Python build scripts:

import os
if "CPATH" in os.environ: os.environ.pop("CPATH")

Now my automated builds are beautifully warning-free again!

Dangerous Logging in Swift

I recently came across a perplexing crash in my unit tests that led me down a path of discovery, culminating in an awareness that “I was holding it wrong” when it comes to using NSLog in Swift.

Here is the source code to an extension on FileManager intended to make it easy to read the last modification date of a file:

@objc(rsLastModificationDateAtURL:)
func lastModifedDate(at url: URL) -> Date? {
    do {
        let resourceValues = try url.resourceValues(forKeys: [.contentModificationDateKey])
        return resourceValues.contentModificationDate
    } catch {
        NSLog("Failed to get modification date at URL: \(url) - \(error)")
        return nil
    }
}

I’ve highlighted the line of interest, an invocation of NSLog in the case where a modification date could not be read because of some exception. For example, if the file were not found this line of code would be reached. Looks innocent enough, right? Here’s what I came up against while running the unit tests for one of my apps:

highlighted source code line showing NSLog invocation crashing with EXC_BAD_ACCESS

At first I thought that one of the url or the error variables must be bad. After all, Swift string interpolation and NSLog are both battle-tested. Surely if there were a way to easily crash by logging good variables, it would be fixed a long time ago. But no, both of the variables in this instance were perfectly valid references. So what gives?

The Problem

The problem is rooted in the fact that NSLog from Swift calls through to the underlying C-based interface which supports template strings and variadic arguments. This is why, for example, you can invoke NSLog(@"Hi %@", name) in Objective-C and, if name represents the string “Daniel”, you get “Hi Daniel” printed to the console.

In the scenario of my crash, the interpolation of “url” and “error” results in surprise template placeholders, because of the presence of spaces in the path that the URL represents. In my tests, a file called “Open Program Ideas File” exists and is used to test some file manipulations. When the path to this file is encoded as a URL, the name of the file becomes “Open%20Program%20Ideas%20File”. Since the error’s failure message reiterates the name of the file it couldn’t find, we end up with another copy of the percent-escaped string in the parameter to NSLog. Each instance of “%20” followed by a letter is liable to be interpreted by NSLog as a printf-style format specifier. So as far as our filename’s string is concerned, we have “%20P”, “%20I”, and “%20F” threatening to cause trouble. Capital letters in printf formats are pretty uncommon, but the %F format specifier is documented as:

64-bit floating-point number (double), printed in decimal notation

In short, we have a situation where logging the URL and the error inadvertently asks NSLog to look for a 64-bit floating point number in the arguments list. A 64-bit floating point number of size 20, whatever that means in this case. So, whether the unit test, or app, crashes or not in a situation like this depends entirely on what data happen to be in the places where the variadic arguments would be, and whether that data causes a crash when attempting to interpret it as a type of the specified print format.

How to Fix It

So how do we fix it? Well, we need to make sure that the string that ultimately gets passed to NSLog doesn’t contain these surprise placeholder values. If this were Objective-C, we wouldn’t run into the problem because the parameters would need to be passed as variadic arguments:

NSLog(@"Failed to get modification date: %@ - %@", url, error);

But if we try that in Swift, we run into trouble. NSLog in Swift doesn’t support variadic arguments:

screenshot of build error indicating that variadic arguments are not allowed with NSLog in Swift

I’m pretty sure this is how I ended up in this situation in the first place: I probably tried to adapt my old Objective-C code to Swift, ran into this error, and obediently changed to using inline variable substitution instead. It just seemed like “the Swift thing to do.” But if we can’t use NSLog with inline substitution, and we can’t use variadic arguments, what are we supposed to do? Update: Thanks to Sebastian Celis for pointing out on Twitter that variadic arguments do work with NSLog. I think the failure above is specifically because I’m passing non-NSObjects to NSLog, which isn’t supported.

A few years ago Apple introduced a new logging framework called the Unified Logging System, which supports logging with variadic arguments from both Swift and Objective-C. It also supports a host of other features that allow you to categorize and prioritize your log message and, well, it sounds great, but it’s also quite a bit more complicated than just invoking NSLog. It’s complicated enough that I can’t offer a one-line fix for the situation I’ve described here, but I encourage you to investigate your options.

Audit Your Code

I also encourage you to audit your own code, and I’ll describe a method for searching your own code base to see if you might be vulnerable to the kind of unpredictable crash that inline interpolation can cause with NSLog. In Xcode, create a custom search scope that allows you to easily search just the Swift files in your code base, then search for instances of the problematic pattern. Obviously if you’ve got a 100%-Swift code base, creating the custom search scope is not necessary:

  1. Show the Find Navigator by selecting View -> Navigator -> Find from the menu bar.
  2. Click the “In Project” (by default) search scope label beneath the search field. This reveals the list of search scopes currently configured in your workspace.
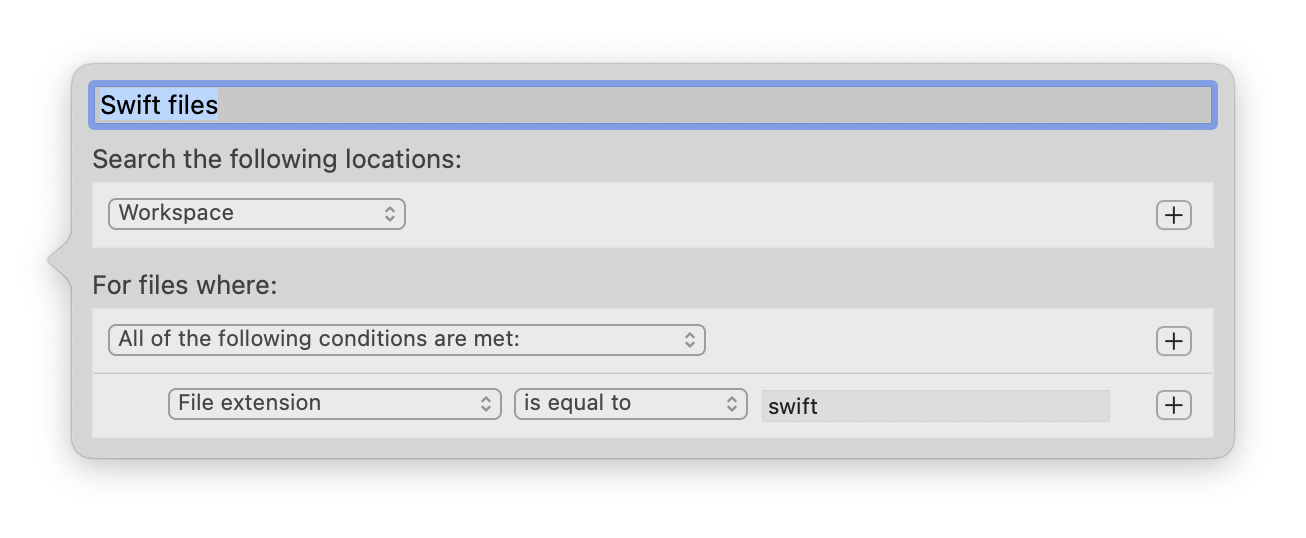
  3. Click the “New Scope” button and configure a scope designed to match all files with the “swift” file extension”:

    screenshot of custom search scope popover showing title

  4. Click the Find type (“Text” by default) in the search parameters above the search field, and change it to “Regular Expression”.
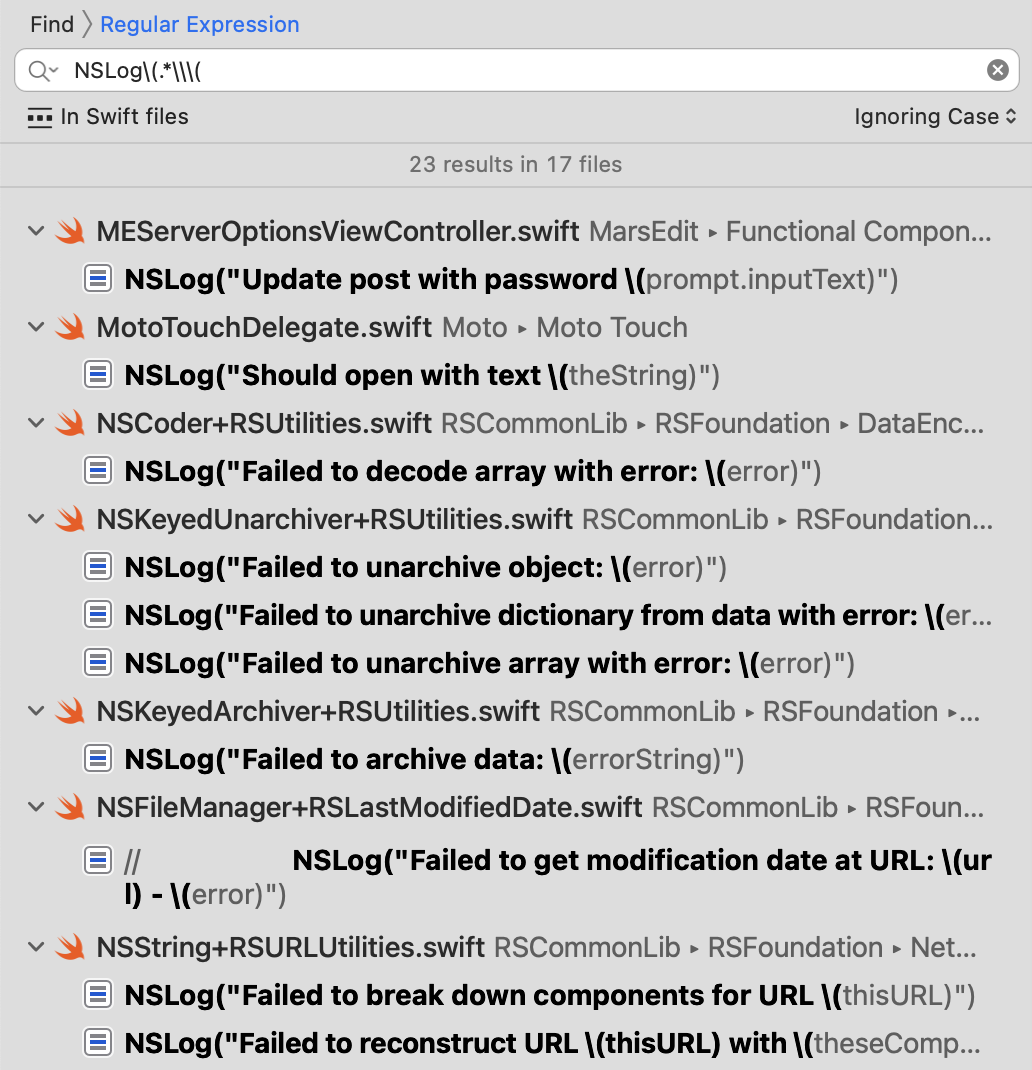
  5. Type or paste in the search string NSLog\(.*\\\( — this is a regular expression that will find intances of the string “NSLog(” followed by any number of characters that includes the substring \(, the tell-tale sign of Swift string interpolation:

    screenshot of search results showing multiple files with

In my own code base, this audit results in an alarming 23 instances in 17 files, all of which I will soon be converting to a safer logging method. I encourage you to do the same in your code base. Hopefully you’ll have been followingn a safer pattern all along and won’t have any work to do, but if you’re anything like me, you might find you’re more vulnerable to the problem than you thought!

Discoverable Key Commands

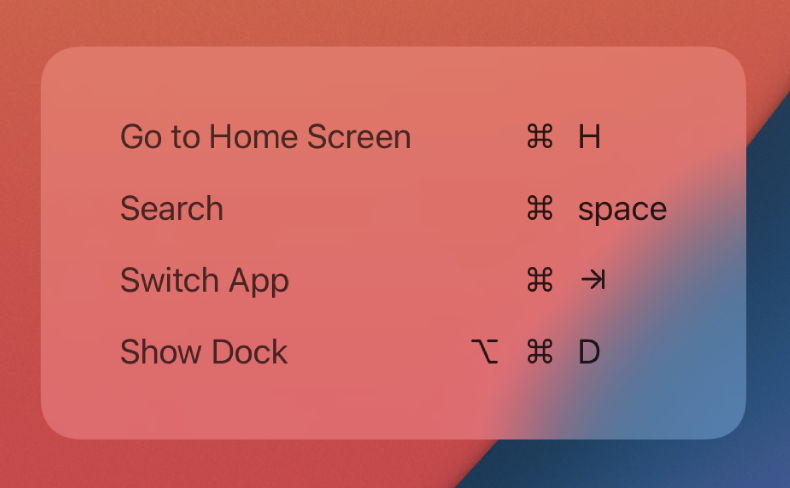
As I make progress on Black Ink for iOS, I have taken care to add keyboard shortcuts to make the app more usable on an iPad with external keyboard. One standard behavior of iPadOS is that when an app supports keyboard shortcuts, simply holding down the command key presents a nice heads-up display (HUD) with the list of shortcuts. For example, if you press the command key on the iPad home screen, you’ll see something like this:

Screenshot of prompt showing list of keyboard shortcuts on iPad.

This panel is supposed to appear automatically for any app that declares keyboard shortcuts using the UIKeyCommand interface of UIKit, which Black Ink does. I couldn’t figure out why the panel never appeared in the app. When the Command key is pressed, I confirmed that my puzzle view was the “first responder”, meaning it is the view that iOS should consult when building the list of key commands to show. What could possibly be going wrong?

Never being one to take the easy route when solving a problem, I found myself tracing the UIKit system code deep into the infrastructure that determines whether or not to show a panel or not. When the command key is held for a sufficiently long time, an internal timer expires and “-[UIKeyCommandDiscoverabilityHUD _HUDPopTimerFired:]” is reached. This method ends up calling a private “_performableKeyCommandsWithResponder:” method, which finally leads to some code that … asks each UIKeyCommand for its discoverabilityTitle, or as a backup, its title. Hmm, what is the discoverability title? Let’s look at the header for UIKeyCommmand:

// Creates an key command that will _not_ be discoverable in the UI.
+ (instancetype)keyCommandWithInput:(NSString *)input modifierFlags:(UIKeyModifierFlags)modifierFlags action:(SEL)action;

// Key Commands with a discoverabilityTitle _will_ be discoverable in the UI.
+ (instancetype)keyCommandWithInput:(NSString *)input modifierFlags:(UIKeyModifierFlags)modifierFlags action:(SEL)action discoverabilityTitle:(NSString *)discoverabilityTitle;

Face, meet palm.

When implementing support for keyboard shortcuts, I had leaned on code completion and went with the easiest option. The shortcuts worked, so what could go wrong? It turns out you have to declare a title for UIKeyCommand or the system won’t present a prompt to users about it. It makes sense, because what would it list as the explanation for what it does, if nothing is set on it?

After I added discoverability titles, everything looks as it should:

Screenshot of Black Ink for iOS showing a full list of keyboard shortcuts for puzzle navigation, etc.

Hopefully this will help others who are stuck trying to figure out why their app’s keyboard shortcuts aren’t showing up.

Xcode 11.4 Beta 1: Couldn’t Load Spec With Identifier

When Apple updates Xcode, they usually add a slew of deprecations and warnings that might turn your otherwise warning-free project into a virtual hailstorm of yellow warning triangles.

One of the warnings that popped up for me with the recent Xcode 11.4 Beta 1 release, is this inscrutable little gem:

Screenshot of a warning from Xcode. Text in post content below.

Hmm, “Couldn’t load spec with identifier ‘com.apple.compilers.gcc.4_0’ in domain ‘macosx'”, what does it mean? I know this is an old project, and has a lot of history. Maybe I have some old GCC setting that needs to be zapped? I searched the build settings for “gcc” but nothing came up at all, and certainly nothing with the specificity of “gcc.4_0”.

I was perplexed. Rather than fish around any longer in Xcode, I headed to Terminal for some brute force searching:

% cd /path/to/My.xcodeproj
% grep -r gcc *
project.pbxproj:			compilerSpec = com.apple.compilers.gcc.4_0;
...

Aha! Let’s open that file up and see what the context is for these:

65F44C4917D681F3002A02AA /* PBXBuildRule */ = {
	isa = PBXBuildRule;
	compilerSpec = com.apple.compilers.gcc.4_0;
	fileType = sourcecode.c;
	inputFiles = (
	);
	isEditable = 1;
	outputFiles = (
	);
};

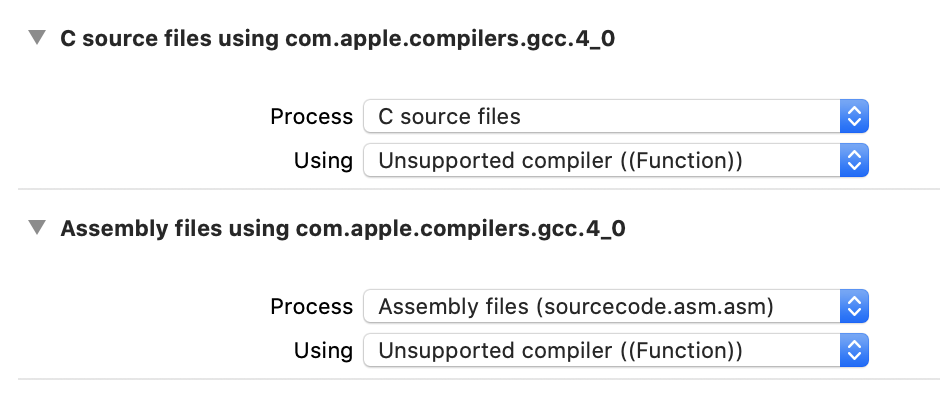
Build rules? We don’t need no steekin’ build rules! I have rarely used a custom build rule, so never think to search in that tab when examining a target’s properites. Particularly not when I’m coping with new Xcode warnings. Sure enough, I took a look in the Build Rules tab and found these:

Screenshot of Xcode's build rules editor, listing two custom rules, one for C file and one for Assembly files, specifying an

These custom build rules must have come from a time when the target included C and Assembly files. These days, it only contains Objective-C files, so I feel extra safe in deleting these. After doing so, the new warnings are gone.

Let it Rip

In the latest Mojave public beta, I noticed a foreboding warning in the console when I build and run FastScripts, my macOS scripting utility:

FastScripts [...] is calling TIS/TSM in non-main thread environment, ERROR : This is NOT allowed. Please call TIS/TSM in main thread!!!

Ruh-roh, that doesn’t sound good. Particularly with the emphasis of three, count them three, exclamation points! I better figure out what’s going on here. But how?

Sometimes when Apple adds a log message like this, they are kind enough to offer advice about what to do to alleviate the problem. Sometimes the advice implores that we stop using a deprecated method, or in a scenario like this, offers a symbolic breakpoint we might set to zero in on exactly where the offending code lies. For example, a quick survey of my open Console app reveals:

default	11:54:18.482226 -0400	com.apple.WebKit.WebContent	Set a breakpoint at SLSLogBreak to catch errors/faults as they are logged.

This particular warning doesn’t seem to apply to my app, but if it did, I would have something good to go on if I wanted to learn more. With the TIS/TSM warning, however, I have no idea where to go. Do I even use TIS/TSM? What is TSM?

I’ve worked on Apple platforms for long enough to know that TSM stands for Text Services Manager. However, I have also worked on these platforms long enough to forget whether I’ve actually used, or am still using, such a framework in my apps! When these kinds of warnings appear in the console, as many times as not they reflect imperfections in Apple’s own framework code. Is it something Apple’s doing, or something I’m doing, that’s triggering this message?

Ideally we could set a breakpoint on the very line of code that causes this console message to be printed. This can be surprisingly difficult though. There have always been a variety of logging mechanisms. Should you set the breakpoint on NSLog, os_log, printf, fprintf, or write? I could probably figure out a comprehensive method for catching anything that might write to the console, but am I even sure this console method is being generated in my app’s main process? There are a lot of variables here. (Hah! In this particular case, I ended up digging deeper and discovering it calls “CFLog”).

This is a scenario where combining lldb’s powerful “regular expression breakpoints” and “breakpoint commands” can help a great deal. Early in my app’s launch, before the warning messages are logged, I break in lldb and add a breakpoint:

(lldb) break set -r TIS|TSM.*

I’m banking on the likelihood that whatever function is leading to this warning contains the pertinent framework prefixes. It turns out to be a good bet:

Breakpoint 5: 634 locations.

I hit continue and let my app continue launching. Here’s the problem, though: those 634 breakpoint locations include quite a few that are getting hit on a regular basis, and for several consecutive breaks, none of them is triggering the warning message I’m concerned about. This is a situation where I prefer to “let it rip” and sort out the details later:

(lldb) break command add 5
Enter your debugger command(s).  Type 'DONE' to end.
> bt
> c
> DONE
(lldb) c
Process 16022 resuming

What this does is add a series of commands that will be run automatically by lldb whenever breakpoint 5 (the one I just set) is hit. This applies to any of the 634 locations that are associated with the regular expression I provided. When the breakpoint is hit, it will first invoke the “bt” command to print a backtrace of all the calls leading up to this call, and then it will invoke the “continue” command to keep running the app. After the app has run for a bit, I search the debugger console for “!!!” which I remembered from the original warning. Locating it, I simply scroll up to see the backtrace command that had most recently been invoked:

  thread #7, stop reason = breakpoint 5.568
    frame #0: 0x00007fff2cd520fd HIToolbox`TSMGetInputSourceProperty
    frame #1: 0x00000001003faef2 RSFoundation`-[RSKeyboardStatus update](self=0x00006000002b8c00, _cmd="update") at RSKeyboardStatus.m:56
    [...]

Command #2 'c' continued the target.
2018-08-14 12:15:40.326538-0400 FastScripts[16022:624168] pid(16022)/euid(501) is calling TIS/TSM in non-main thread environment, ERROR : This is NOT allowed. Please call TIS/TSM in main thread!!! 

Sure enough, that’s my code. I’m calling TSM framework functions to handle key translation for FastScripts’s keyboard shortcut functionality, and I’m doing it (gasp!) from thread #7, which is certainly not the main thread. I oughta be ashamed…

But I’m proud, because I tracked down the root of the problem pretty efficiently using lldb’s fantastic breakpoint commands. Next time you’re at a loss for how or where something could possibly be happening, consider the possibility of setting a broad, regular expression based breakpoint, and a series of commands to help clarify what’s happening when those breakpoints are hit. Then? Let it rip!

IDEBundleInjection Signing Failure

When a unit test bundle is built to be dynamically injected into a host app, Xcode performs a little dance at build time, in which it adds its own IDEBundleInjection.framework to the bundle, then re-signs it with the developer’s code signing identity.

Normally this all goes off without a hitch, but today when I went to build and test such a bundle, I was met with a rude code signing failure:

IDEBundleInjection.framework: unsealed contents present in the root directory of an embedded framework

I took all the usual steps when facing an obtuse error: clean the build directory, quit and restart Xcode, etc. Nothing fixed it, so I thought perhaps it was an issue with the 9.3 beta Xcode I was running. Nope. Same problem with 9.2. Finally, I made my own copy of the framework in question, and ran “codesign” against it myself from the Terminal. Same error!

This framework, stored within Xcode itself, has become unsignable. Running “codesign -v” against the framework in place also confirms that the code signing seal has been broken. What happened to my Xcode?

It occurred to me that I recently migrated from one Mac to another, and copied my Xcode when I did. I tried to use the Apple-standard migration assistant, but it failed, so I ended up using Finder, or ditto from the Terminal, to copy everything over. Maybe something was messed up in the transition?

The codesign utility is useful for letting me know that something is wrong, but doesn’t actually do me the favor of telling me what it is! Luckily, I have a backup of my whole disk and the original Xcode on that volume appear to have properly signed internal frameworks. Running a diff on IDEBundleInjection.framework between the two copies, I do see some reported distinctions. Where “.” is the current, misbehaving framework:

Only in .: .BC.D_QdfhyO
Only in .: .BC.D_mgLUu2
Only in ./Versions: .BC.D_gSVCxT

These appear to be redundant cruft correlating to the expected internal version links. For every link like:

IDEBundleInjection -> Versions/Current/IDEBundleInjection

I have one of these unexpected garbage links. The presence of these links are, of course, detected by codesign, and it throws everything off.

I don’t know why these mysterious gremlin files showed up on my Mac, but whatever the cause, there’s an easy solution. I’m taking a leap of faith that I don’t actually want any of these files:

cd /Applications/Xcode.app
find . -name ".BC.*" -delete

And now I can get back to unit testing my app.

Intrinsic String Encoding

I was baffled today while investigating a bug in MarsEdit, which a customer reported as only seeming to affect the app when writing in Japanese.

I pasted some Japanese text into the app and was able to reproduce the bug easily. What really confused me, though was that the bug persisted even after I replaced the Japanese text with very straight-forward ASCII-compatible English. I opened a new editor window, copied and pasted the English text in, and the bug disappeared. I copied and pasted back into the problematic editor, and the bug returned. What the heck? Two windows with identical editors, containing identical text, exhibiting varying behavior? I knew this was going to be good.

It turns out there’s a bug in my app where I erroneously ask for a string’s “fastestEncoding” in the process of converting it. The bug occurs when fastestEncoding returns something other than ASCII or UTF8. For example, with a string of Japanese characaters, the fastestEncoding tends to be NSUnicodeStringEncoding.

But why did the bug continue to occur even after I replaced the text with plain English? Well…

The documentation for NSString encourages developer to view it as a kind of encoding-agnostic repository of characters, which can be used to manipulate arbitrary strings, converting a specific encoding only as needed:

An NSString object encodes a Unicode-compliant text string, represented as a sequence of UTF—16 code units. All lengths, character indexes, and ranges are expressed in terms of 16-bit platform-endian values, with index values starting at 0.

This might lead you to believe that no matter how you create an NSString representation of “Hello”, the resulting objects will be identical both in value and in behavior. But it’s not true. Once I had worked with Japanese characters in my NSTextView, the editor’s text storage must have graduated to understanding its content as intrinsically unicode based. Thus when I proceeded to copy the string out of the editor and manipulate it, it behaved differently from a string that was generated in an editor that had never contained non-ASCII characters.

In a nutshell: NSString’s fastestEncoding can return different values for the same string, depending upon how the string was created. An NSString constant created from ASCII-compatible bytes in an Objective-C source file reports NSASCIIStringEncoding (1) for both smallest and fastest encoding:

printf("%ld\n", [@"Hello" fastestEncoding]);	// ASCII (1)

And a Swift string constant coerced to NSString at creation behaves exactly the same way:

let helloAscii =  "Hello" as NSString
helloAscii.fastestEncoding			// ASCII (1)

But here’s the same plain string constant, left as a native Swift String and only bridged to NSString when calling the method:

let helloUnicode = "Hello"
helloUnicode.fastestEncoding		// Unicode (10)

As confusing as I found this at first, I have to concede that the behavior makes sense. The high level documentation describing NSString representing “a sequence of UTF-16 code units” says nothing about the implementation details. It’s a conceptual description of the class, and for the most part all methods operating on an NSString comprising the same characters should be heave the same way. But the documentation for fastestEncoding is actually pretty clear:

“Fastest” applies to retrieval of characters from the string. This encoding may not be space efficient.

As I said earlier, my usage of fastestEncoding was erroneous, so the solution to my bug involves removing the call to the method completely. In fact, I don’t expect most developers will ever have a legitimate needs to call this method. Forthose who do, be very aware that it can and does behave differently, depending on the provenance of your string data!

Debugging Swift: Error in Auto-Import

Have you ever tried debugging Swift code in an embedded framework, and met resistance from lldb in the form of a cryptic AST context error?

error: in auto-import:
failed to get module 'RSAppKit' from AST context:

<module-includes>:1:9: note: in file included from <module-includes>:1:
#import "Headers/RSAppKit.h"
        ^
error: [...]/RSAppKit.h:1:9: error: 'RSAppKit/SomeHeader.h' file not found
#import <RSAppKit/SomeHeader.h>
        ^

error: could not build Objective-C module 'RSAppKit'

After hours of trying to unravel this mystery, I discovered the root cause: the framework that is embedded in my app does not, in fact, contain any headers. They were stripped by Xcode when it copied the framework into the app.

In my opinion, Xcode and/or lldb should be smart enough to handle this situation, by preferring the version of the framework in the “Built Products” directory, which still has its header files in-tact. Radar #31502879 requests this, hopefully Apple will fix it.

In the mean time, you can work around the problem by setting the REMOVE_HEADERS_FROM_EMBEDDED_BUNDLES build setting to NO in the app that embeds the framework:

Xcode build settings showing REMOVE_HEADERS_FROM_EMBEDDED_BUNDLES set to NO for DEBUG builds.

You probably want to make sure it remains set to YES for Release builds, so that you don’t ship your framework’s header files to your customers.

System Level Breakpoints in Swift

Any great software developer must inevitably become a great software debugger. Debugging consists largely of setting breakpoints, then landing on them to examine the state of an app at arbitrary points during its execution. There are roughly two kinds of breakpoints: those you set on your own code, and those you set on other people’s code.

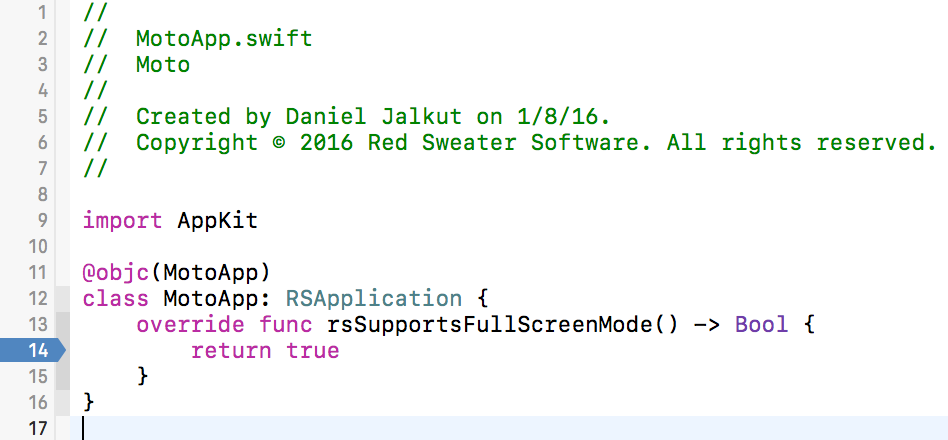
Setting a breakpoint on your own code is simple. Just find the line of source code in your Xcode project, and tap the area in the gutter next to the pertinent line:

MotoAppSwift

But what if you need to set a breakpoint on a system API, or a method implemented in a drop-in library for which you don’t have source code? For example, imagine you are hunting down a layout bug and decide it might be helpful to observe any calls to Apple’s own internal layoutSubviews method on UIView. Historically, to an Objective-C programmer, this is not a huge challenge. We know the form for expressing such a method symbolically and to break on it, we just drop into Xcode’s lldb console (View -> Debug Area -> Activate Console), and set a breakpoint manually by specifying its name. The “b” shorthand command in lldb does a bit of magic regex matching to expand what we type to its full, matching name:

(lldb) b -[UIView layoutSubviews]
Breakpoint 3: where = UIKit`-[UIView(Hierarchy) layoutSubviews], address = 0x000000010c02f642
(lldb) 

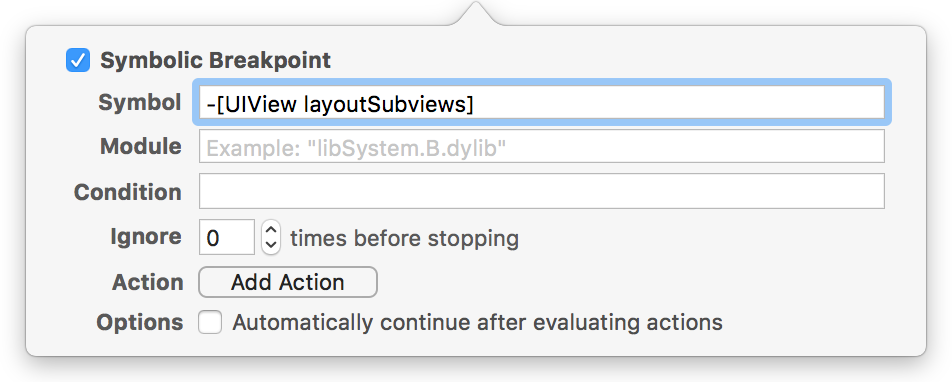
If you’re intimidated by the lldb console, or you want the breakpoint to stick around longer than the current debug session, you can use Xcode’s own built-in symbolic breakpoint interface (Debug -> Breakpoints -> Create Symbolic Breakpoint) to achieve the same thing:

Image of Xcode's symbolic breakpoint editor

In fact, if you add this breakpoint to your iOS project and run your app, I am pretty sure you will run into a breakpoint on Apple’s layoutSubviews method. Pop back into the lldb console and examine the object that is being sent the message:

(lldb) po $arg1
<UIClassicWindow: 0x7f8e7dd06660; frame = (0 0; 414 736); userInteractionEnabled = NO; gestureRecognizers = <NSArray: 0x60000004b7c0>; layer = <UIWindowLayer: 0x600000024260>>

Now, continue and break on the symbol again. And again. Examine the target each time by typing “po $arg1” into the lldb console. You can imagine how handy it might be to perform this kind of analysis while tracking down a tricky bug.

But what about the poor Swift programmers who have come to our platforms, bright-eyed and full of enthusiasm for Swift syntax? They who have read Apple’s documentation, and for whom “-[UIView layoutSubviews]” is impossible to parse, whereas “UIView.layoutSubviews” not only looks downright obvious, but is correct for Swift?

Unfortunately, setting a breakpoint on “UIView.layoutSubviews” simply doesn’t work:

(lldb) b UIView.layoutSubviews
Breakpoint 3: no locations (pending).
WARNING:  Unable to resolve breakpoint to any actual locations.
(lldb) 

This fails because there is no Swift type named UIView implementing a method called layoutSubviews. It’s implemented entirely in Objective-C. In fact, a huge number of Objective-C methods that are exposed to Swift get compiled down to direct Objective-C message sends. If you type something like “UIView().layoutIfNeeded()” into a Swift file, and compile it, no Swift method call to layoutIfNeeded ever occurs.

This isn’t the case for all Cocoa types that are mapped into Swift. For example, imagine you wanted to break on all calls to “Data.write(to:options:)”. You might try to set a breakpoint on “Data.write” in the hopes that it works:

(lldb) b Data.write
Breakpoint 11: where = libswiftFoundation.dylib`Foundation.Data.write (to : Foundation.URL, options : __ObjC.NSData.WritingOptions) throws -> (), address = 0x00000001044edf10

And it does! How about that? Only it doesn’t, really. This will break on all calls that pass through libswiftFoundation on their way to -[NSData writeToURL:options:error:], but it won’t catch anything that calls the Objective-C implementation directly. To catch all calls to the underlying method, you need to set the breakpoint on the lower level, Objective-C method.

So, as a rule, Swift programmers who want to be advanced debuggers on iOS or Mac platforms, also need to develop an ability for mapping Swift method names back to their Objective-C equivalents. For a method like UIView.layoutSubviews, it’s a pretty direct mapping back to “-[UIView layoutSubviews]”, but for many methods it’s nowhere near as simple.

To map a Swift-mapped method name back to Objective-C, you have to appreciate that many Foundation classes are stripped of their “NS” prefix, and the effects of rewriting method signatures to accommodate Swift’s API guidelines. For example, a naive Swift programmer may not easily guess that in order to set a breakpoint on the low-level implementation for “Data.write(to:options)”, you need to add back the “NS” prefix, explicitly describe the URL parameter, and add a mysterious error parameter, which is apparently how cranky greybeards used to propagate failures in the bad old days:

(lldb) b -[NSData writeToURL:options:error:]
Breakpoint 13: where = Foundation`-[NSData(NSData) writeToURL:options:error:], address = 0x00000001018328c3

Success!

For those of you mourn the thought of having to develop this extensive knowledge of Objective-C message signatures and API conventions, I offer a little hack that will likely get you through your next challenge. If the API has been rewritten using one of these rules, it’s almost certain that the Swift name of the function is a subset of the ObjC method name. You can probably leverage the regex matching ability of lldb to zero in on the method you want to set a breakpoint on:

(lldb) break set -r Data.*write
Breakpoint 14: 107 locations.

Now type “break list” and see the massive number of likely matches lldb has presented at your feet. Among them are a number of Swift cover methods that are part of libswiftFoundation, but you’ll also find the target method in question. In fact, you’ll also see a few other low-level Objective-C methods that you may want to break on as well.

To make the list more manageable, given your knowledge that the target methods are in a given Objective-C framework, add the “-s” flag to limit matches to a specific shared library by name:

(lldb) break set -s Foundation -r Data.*write
Breakpoint 17: 8 locations.

Among these breakpoints there are a few false hits on the NSPageData class, but the list is altogether more manageable. The single breakpoint “17” has all of its matches identified by sub-numbers. Prune the list of any breakpoints that get in your way, and you’re good to go:

(lldb) break disable 17.6 17.7 17.8
3 breakpoints disabled.
(lldb) c

Apple’s mapping of Objective-C API to Swift creates an altogether more enjoyable programming experience for Swift developers, but it can lead to great confusion if you don’t understand some of the implementation details, or how to work around lack of understanding. I hope this article gives you the tools you need to debug your Swift apps, and the Objective-C code that you are unavoidably leveraging, more effectively.

Update: I filed two related bugs: Radar #31115822 requesting automatic mapping from Swift method format back to underlying Objective-C methods, and Radar #31115942 requesting that lldb be more intuitive about evaluating terse Swift method signatures.

Pasteboard Priority

A weird bug cropped up in MarsEdit, in which a URL copied and pasted from Safari, for example, was pasting into the plain text editor as the text from the link instead of the link itself. Daring Fireball’s star glyph permalinks to entries presented a most dramatic example. Right-clicking a star glyph and copying the link to paste into MarsEdit was supposed to yield:

Image of pasted link shown as expected with full text content of URL

But instead gave:

Image of pasted URL showing the text of the link instead of the URL content

How strange. What could have possibly changed something so fundamental as the manner in which a pasted link is processed by my text editor? I leaned on Mercurial’s “bisect” command which led me to the specific source code commit where the behavior had changed, in my text view’s helper method for building a list of acceptable paste types. My color emphasis is on the changed part:

-	return [[NSArray arrayWithObject:NSFilenamesPboardType] arrayByAddingObjectsFromArray:[NSImage imageFileTypes]];
+	return [[NSArray arrayWithObject:NSFilenamesPboardType] arrayByAddingObjectsFromArray:[NSImage imageTypes]];

That’s it? One little tweak to the construction of a list of image types affects the behavior of pasting a URL copied from Safari? Programming is hard.

I had made the change above because imageFileTypes is deprecated. The deprecation warning specifically says: “use imageTypes instead.” Okay. Functionally, everything related to the image types should work the same. Instead of a list of file extensions from -imageFileTypes, I’m now getting a list of UTIs. I scrutinized the lists a bit to satisfy myself that all of the major image types were present in the new list, and I trust that Apple had covered the bases when they made this migration themselves.

It turns out the change above, the one word diff that causes everything to work either as expected or otherwise, is fine. It’s outside of this method where the real problem lies: in my override of NSTextView’s -readablePasteboardTypes method. In it, I endeavor to combine my own list of pasteable types with NSTextView’s own list. To do this, I create a mutable set to combine -[super readablePasteboardTypes] and my own list, and then return an array of the result. The idea is to avoid listing any items redundantly from the built in list and my own:

- (NSArray*) readablePasteboardTypes
{
	NSMutableSet* allReadableTypes = [NSMutableSet setWithArray:[super readablePasteboardTypes]];
	[allReadableTypes addObjectsFromArray:[self acceptableDragTypes]];
	return [allReadableTypes allObjects];
}

Ah, my spidey sense is finally starting to tingle. While it’s not mentioned in the NSTextView reference documentation, the NSTextView.h header file includes comments about this method that are pertinent here:

Returns an array of types that could be read currently in order of preference.  Subclassers should take care to consider the "preferred" part of the semantics of this method.

Ah, so order matters. Of course. And what does the -[NSSet allObjects] say about order?

The order of the objects in the array is undefined.

So all this time, I’ve been playing fast and loose with NSSet, lucking out with the coincidence that types I prefer would show up higher in the list than types I don’t prefer. It turns out that “public.url” is among the types included in NSTextView’s own, built-in readablePasteboardTypes method implementation, but previous to this change, it always showed up lower in resulting list than NSStringPboardType. Thus, when faced with an opportunity to paste a URL from Safari, rich with information including the original text from the link, MarsEdit always favored the plain string representation.

Changing from -[NSImage imageFileTypes] to -[NSImage imageTypes] effectively changed the roll of the dice, causing the resulting array from NSSet, documented as being “undefined” in its order, to place the URL type above the string type in the list. Thus it tries to paste as a rich URL with text linking to a URL, but since my plain text HTML editor doesn’t support rich text, all you see is the star.

The fix will be to arrange that my resulting array from readablePasteboardTypes does impose some predictable prioritization. Probably by taking the code that I have now and, after generating the list of all unique types, carefully moving a few types to the top of the list in the order that I’d prefer.