Category Archives: iOS

Constraint Activation

I got started with Auto Layout a few years ago, and on the whole I’m very happy with the framework. It can be exceedingly frustrating at times, especially when some nuanced constraint priority or other is imposing a layout that just doesn’t make sense. But I measure its value by the degree to which I shudder in imagining going back to the old springs and struts approach.

Although some interfaces work perfectly with a fixed set of constraints, other interfaces require dynamic manipulation at runtime in order to achieve the desired result. For example, if a change in a preferences panel brings in some new element to the UI, it might make sense to adjust constraints at runtime to accommodate it.

Prior to OS X 10.10 and iOS 8.0, this could be achieved in a general case by removing and adding constraints as needed to the view in question:

  1. Remove constraints and save them somewhere, e.g. in an array, for later.
  2. Add or remove elements to the view.
  3. Add constraints, e.g. by fetching them from a saved array.

It is important to remove constraints and save them before removing an affected element, because removing the element will cause the constraint to be implicitly removed before you can save it.

Starting in OS X 10.10 and iOS 8.0, I was intrigued by the announcement that NSLayoutConstraint now supports a property called “active,” which can be used to, you guessed it, activate or deactivate a constraint. I assumed this would be an answer to my prayers: a constraint could now be left installed on a view for safe-keeping, but its impact on layout would be negated by setting it to be “inactive.” I envisioned setting up competing groups of constraints on a view and simply activating or deactiving them en masse when the need arose.

I assumed wrong.

Looking at the documentation more closely, I see the description of what the method actually does:

Activating or deactivating the constraint calls addConstraint: and removeConstraint: on the view that is the closest common ancestor of the items managed by this constraint. Use this property instead of calling addConstraint: or removeConstraint: directly.

The rub is that an NSLayoutConstraint whose “active” is set to false will be removed from view it is installed on. So if you have any hopes or dreams of reapplying that constraint later, you’ll need to save it somewhere, just as before. If you don’t keep a strong reference to the constraint, it may be deallocated. If you tried to go back and set “active” a constraint that you referenced as a weak IBOutlet, for example, it would be nil by the time you tried to do so.

The OS X 10.10 AppKit Release Notes makes a clearer emphasis on the intended utility of the “active” property:

Under Mac OS X 10.10, it is now possible to directly activate and deactivate NSLayoutConstraint objects, without having to worry about adding them to an appropriate ancestor view. This is accomplished by manipulating NSLayoutConstraint’s new boolean property ‘active’. Class methods are available for operating on multiple constraints simultaneously, which can be much faster. The legacy API on NSView for adding & removing constraints is now deprecated.

So “active” is not a convenience for easily toggling whether an installed layout constraint has an effect or not, but a convenience for the plumbing of installing and removing them. The emphasis on adding and removal API being deprecated especially underscores that.

Having written this all out, it suddenly occurs to me that the “active” flag I was dreaming of is actually sort of available, and has been all along. Because NSLayoutConstraint supports a mutable “priority” property, you can effectively disable it by setting its priority lower than any other constraints that affect the same view. One caveat though is you can’t change a constraint’s priority to or from “required” at runtime, so you have to choose a priority lower than 1000. Something like this should work:

NSLayoutPriority newPriority = activate ? 999 : 1;
[dynamicConstraint setPriority:newPriority];

So long as a set of counterpart constraints affecting similar views is always prioritize to the inverse when toggling state, something like this should workâ„¢. Of course, it requires knowing the “active” priority in code. If a given disabled constraint should actually have priority 501 or 250, or whatever, then you’d have to save that priority somewhere. In which case you may as well go back to saving the whole constraint.
Remote Codesign Trust

It’s common to use a remote, headless build server to perform iOS or Mac builds for which the “codesign” tool must be run to sign either the resulting binary, the installer package, or both.

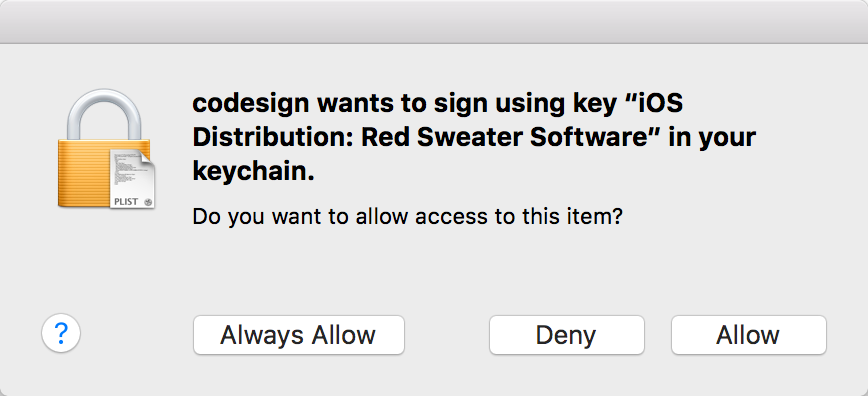
My friend Mitch Cohen raised a concern on our local CocoaHeads that, since 10.11.1 was released, there is a problem with such setups. The dialog that pops up when using a code signing identity for the first time ignores clicks to the “Allow” and “Always Allow” buttons:

Panel prompting to allow permission to use codesign tool with private key.

If you look in the system Console, you see a line along the lines of this, correlated to each attempted click of an “Allow” button:

3/15/16 8:51:55.303 AM SecurityAgent[65532]: Ignoring user action since the dialog has received events from an untrusted source

The changes are apparently rooted in a legitimate security update made by Apple, but the end result for us developers is pretty bleak. It’s seemingly impossible to authorize use of a code signing identity on a remote server. As my friend Mitch put it, he has to call IT and “get someone to go into the data closet” every time this happens. What a drag!

I’m also affected by this issue, since I use a headless Mac Mini as a build server. Lucky for me the server is in my house, but it’s still a drag to have to go log in and control the computer with an attached keyboard.

I poked around for a solution to this problem, and found it lurking in the answers and comments of a Stack Overflow question. The basic idea is you can convince OS X to trust codesign to use the tool, just as if you had clicked the “Allow” button in that UI prompt. Here is a recipe for doing just that, logged in as a remote user over say Screen Sharing:

  1. Open Keychain Access and locate the pertinent private key. You may have to click on the “Certificates” section and then type in part of the name of the identity in question, e.g. “iPhone Distribution”:

    Screenshot of Keychain Access showing the private key

  2. Click the private key and then select File -> Export Items from the menu bar. Save the item anywhere on your server, for example the Desktop. Give it a password e.g. “hardpassword”.
  3. Now stop. Think real hard before you continue. You should have a backup of that private key somewhere. If you don’t? Don’t continue. Did you just make a backup to the Desktop? Yes, in theory. But if these are the only two copies of this private key you need to think long and hard before you continue with the next step, which I absolutely do not advise you to do.
  4. Delete the private key from your keychain. This is the scary (see above), but necessary step to get the Keychain to respect the new permissions you’re going to grant the key in a minute.
  5. Switch to the Terminal and issue a command like the following:
    security import ~/Desktop/Certificates.p12 -k ~/Library/Keychains/login.keychain -P hardpassword -t priv -T /usr/bin/codesign -T /Applications/Utilities/Keychain\ Access.app
    

    It may be important to specify the path to the specific keychain, and to belabor the point you’re importing a private key with the “-t priv” parameter. It seemed like maybe things weren’t working for me until I deigned to include these. In any case, the goal here after running this command is that the private key shown in the screenshot above should now be back in your keychain, but if you double-click it to examine its permissions, you’ll find that codesign is listed among the approved apps. If you need to provide access to other tools than codesign, list them as shown above with multiple -T parameters to the “security import” command.

In my tests that seems to address the issue. After following the recipe above carefully, I can remotely “codesign” with the specified identity to my heart’s content, without a UI prompt of any kind.

It strikes me that this trick probably shouldn’t work, at least in light of Apple’s clamping down on the ability to change authorizations through the UI of Keychain Access. So I won’t be surprised if this series of tricks doesn’t stand the test of time. For now though? No need to call IT and have them go into the data closet.

Update: Erik Schwiebert reports that Apple has addressed this problem in 10.11.4 betas:

That’s great news!

Unsteady Platform

I ran into a vexing build failure with one of my iOS integration builds. The vast majority of everything in my complex project, consisting of dozens of dependencies, has built fine, but at link time things blow up because one of the dependencies is not of the expected architecture.

Undefined symbols for architecture armv7:
"_RSIsEmpty", referenced from:
-[RSFormattingMacro emptyMarkupPlaceholders] in RSFormattingMacro.o
ld: symbol(s) not found for architecture armv7

Ugh, huh, wha? How is this happening? It turns out the library in which “RSIsEmpty” resides, RSFoundation, is being linked to, but it’s opting for an OS X version of the library instead of an iOS one. Because this is an integration build that performs a number of related builds for both Mac and iOS, it makes some sense that I would have both an iOS and OS X build result in the build folder. But even if I have built copies for either architecture, why is it opting for the OS X version on an iOS build?

I decided to blow away all the built versions of RSFoundation and try the build again. This time, I got an even more perplexing failure:

clang: error: no such file or directory: '[...]/build-Integration/Release/RSFoundation.framework/RSFoundation'

I’m scratching my head. Did it somehow get removed as a dependency? But then I notice something subtle. It’s looking for the framework in the “Release” build folder, but for my iOS build it should be looking in “Release-iphoneos”. What the heck is going on?

In spite of the sole build target in this scheme being an iOS app, Xcode (actually xcodebuild) is opting to build this scheme with a default destination of OS X. I don’t know of a direct way to get xcodebuild to list the available destinations for a scheme, but I know that if you pass a bogus destination platform, it will do the honor of listing its impressions:

xcodebuild -destination "platform=xx" -scheme MyIPhoneApp

The requested device could not be found because no platform could be found for the requested platform name.

Available destinations for the "MyIPhoneApp" scheme:
		{ platform:OS X, arch:x86_64 }
		{ platform:iOS Simulator, id:6DF04FFC-1C8A-4745-8F8C-7369E9CBF8DB, OS:9.3, name:iPad 2 }
		[... every other iOS simulator on my Mac ...]

Aha! So it thinks my iPhone app is suitable for OS X. But why? After a great deal of experimentation and poking around, I discovered the root of the problem is summarized by this true statement:

If any target in a Scheme’s dependency tree targets OS X, then the scheme itself will also be considered to target OS X.

In retrospect, this explains the problem perfectly. I had recently added a subproject to my dependency tree that builds both an iOS and a Mac version of a library. That’s fine: it works pretty well these days to allow targets for differing platforms to coexist in the same project file. But each of these targets also shares a dependency on a single, legitimate OS X target: a helper tool used in the process of generating that project’s own source files.

This must be at least a relatively common scenario for iOS builds of certain complexity. Because the platform on which all iOS builds run is OS X, any helper tools that are compiled and used in the process of generating sources or otherwise processing build materials, must be built for OS X.

The workaround to my specific problem is to specify a platform explicitly on the command line. I can’t assume that because the scheme targets iOS, it will necessarily default to an iOS platform target. I consider this a bug, not only because it led to this difficult to diagnose build error, but because it has other ramifications such as the presentation in Xcode’s scheme popup for these projects a useless, distracting “My Mac” target which should never be selected for the schemes in question.

I filed this as Radar #24247701: A scheme whose target has dependencies on another platform shouldn’t “support” that platform.

Right Storyboard, Wrong Platform

If, in haste, you inadvertently add a storyboard file to your Mac or iOS project from the wrong platform palette, you’ll end up with a storyboard that compiles and installs into the app bundle, but which products cryptic errors upon building and running. For example, a Mac storyboard lost in an iOS world:

*** Assertion failure in -[UIStoryboard initWithBundle:storyboardFileName:identifierToNibNameMap:designatedEntryPointIdentifier:], /SourceCache/UIKit_Sim/UIKit-3347.44.1/UIStoryboard.m:52

*** Terminating app due to uncaught exception 'NSInternalInconsistencyException', reason: 'Invalid parameter not satisfying: nibNameMap != nil'

The assertion above occurs when, internally to UIStoryboard, the Info.plist for your compiled “.storyboardc” file is consulted to determine its constituent “.nib” files. In the Mac case, the keys for storyboard Info.plist entries have an “NS” prefix, e.g. NSViewControllerIdentifiersToNibNames, whereas on iOS, it goes hunting for a UI-prefixed key: UIViewControllerIdentifiersToNibNames.

Granted, as soon as you proceeded to the next step, trying to populate the storyboard with UI elements that make sense for the platform, you would probably figure out your mistake. But if you’re just trying to get the ball rolling and end up immediately scratching your head over the failure, hopefully this blog post will have helped you figure out more quickly what was wrong.

I don’t think there’s any official way to change a created storyboard’s platform target. Best bet if you run into this is to delete the storyboard and recreate it from scratch, taking care to select the file template from the appropriate platform in Xcode’s “New File” panel.

Xcode Consolation

One of the best things any Mac or iOS developer can do to improve their craft is to simply watch another developer at work in Xcode. Regardless of the number of years or the diversity of projects that make up your experience with the tool, you will undoubtedly notice a neat trick here or there that changes everything about the way you work.

If you were sitting in my office on a typical workday, looking over my shoulder, that would be a little creepy. But one thing you’d notice that differentiates me from many others is the amount of time I spend typing into the Xcode debugger console.

In my experience, other developers fall into three groups when I mention that I use the console almost exclusively when interacting with the debugger:

  1. Those who share this approach. We exchange high-fives and move on.
  2. Those who appreciate the console for occasional tricks, but rely mostly on the variables view.
  3. Those who have never heard of or noticed the console.

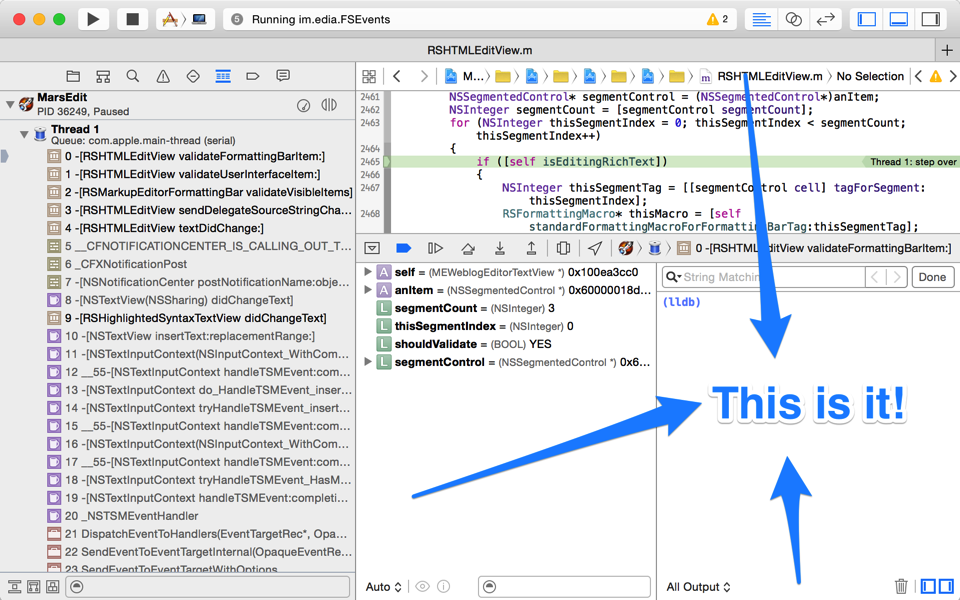
Let’s assume for the sake of argument that you fall into group 3. You can show the console while debugging any process by selecting View -> Debug Area -> Activate Console from the menu bar. In fact, I do this so often that that the keyboard shortcut, Cmd-Shift-C, is completely second-nature to me.

Xcode window with console highlighted.

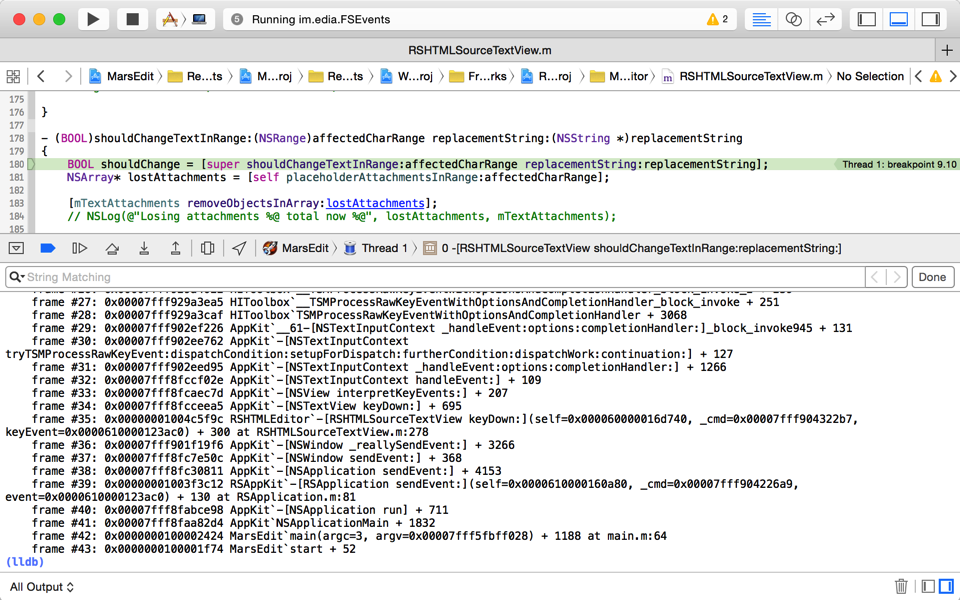
In fact I find the console so useful that it’s not unusual for me to hide much of the other junk, so I can have a mainline connection to the debugger.

Xcode window with large console area

So let’s go back again to the uncomfortable assumption that you’re sitting in my office, looking over my shoulder. What would you see me do in the console? All manner of things: For one thing I rarely click those visual buttons for stepping through code. Instead, I use these terse keyboard aliases, inherited from the bad old Gdb days. In lldb, these all come as standard abbreviations of more verbosely named commands:

  • n – step over the next line of source
  • s – step into the first line of source of a function
  • ni – step over the next instruction of assembly code
  • si – step into the first instruction of a function
  • c – continue
  • fin – continue until return from current stack frame

Those are the basics, but another trick, I believe it was called ret in Gdb, comes in handy often:

  • thread return – return immediately from the current stack frame

You could use this if you are stuck in some function that is crashed, for example, but you know that returning to the caller would allow the process to continue running as normal. Or, you could use it to completely circumvent a path of code by breaking on a function and bolting right out, optionally overriding the return value. Just to pick an absurd example with flair, let’s stub out AppKit’s +[NSColor controlTextColor]:

(lldb) b +[NSColor controlTextColor]
Breakpoint 1: where = AppKit`+[NSColor controlTextColor], address = 0x00007fff8fb05572
(lldb) break command add
Enter your debugger command(s).  Type 'DONE' to end.
> thread ret [NSColor redColor]
> c
> DONE
(lldb) c

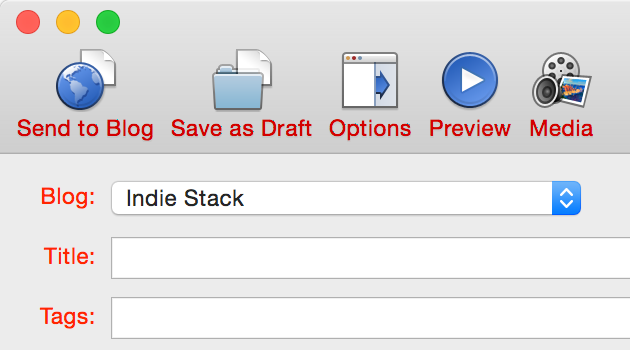
Here we have opted to break on every single call to controlTextColor, returning to the caller with a fraudulent color that is apparently not consulted by the label for this popup menu in MarsEdit:

MarsEdit screenshot with labels drawn in red

In fact, mucking about with system symbols is one of the great tricks of the console, and lldb’s built-in “breakpoint” command brings with it superpowers that can’t be touched by Xcode’s dumbed down GUI-based controls. For example, what if we wanted to set a breakpoint that would catch not only +controlTextColor, but any similar variation? Using lldb’s support for regular expression breakpoints, it’s a snap:

(lldb) break set -r control.*Color -s AppKit
Breakpoint 1: 20 locations.

Here we request that a breakpoint be set for any symbol in the AppKit framework that contains the lower-cased “control,” followed by anything, then capitalized “Color.” And lldb just set 20 breakpoints at once. To see them all, just type “breakpoint list” and you’ll see all the variations listed out as sub-breakpoints:

(lldb) break list
Current breakpoints:
1: regex = 'control.*Color', locations = 20, resolved = 20, hit count = 0
  1.1: where = AppKit`+[NSColor controlTextColor], address = 0x00007fff8fb05572, resolved, hit count = 0 
  1.2: where = AppKit`+[NSDynamicSystemColor controlTextColor], address = 0x00007fff8fb05670, resolved, hit count = 0 
  1.3: where = AppKit`+[NSColor controlBackgroundColor], address = 0x00007fff8fb1465d, resolved, hit count = 0 
  1.4: where = AppKit`+[NSDynamicSystemColor controlBackgroundColor], address = 0x00007fff8fb1475d, resolved, hit count = 0 
  (etc...)

One major shortcoming of all this goodness is Xcode has a mind of its own when it comes to which breakpoints are set on a given target. Anything you add from the lldb prompt will not register as a breakpoint in Xcode’s list, so you’ll have to continue to manipulate it through the console. You can enable or disable breakpoints precisely by specifying both the breakpoint number and its, umm, sub-number? For example to disable the breakpoint on +[NSColor controlBackgroundColor] above, just type “break disable 1.3”.

Regular expressions can be very handy for setting breakpoint precisely on a subset of related methods, but they can also be very useful for casting about widely in the vain pursuit of a clue. For example, when I’m boggled by some behavior in my app, and suspect it has to do with some system-provided API, or even an internal framework method, I’ll just throw some verbs that seem related at a breakpoint, and see what I land on. For example, it seems like some delegate, somewhere should be imposing this behavior:

(lldb) break set -r should.*:
Breakpoint 5: 735 locations.

That’s right, set a breakpoint for any ObjC method that includes the conventional “shouldBlahBlahBlah:” form in its selector name. Or if you are really at your wit’s end about an event related issue, why not capture the whole lot and see where you stand?

(lldb) break set -r [eE]vent
Breakpoint 10: 9520 locations.

Sometimes I’ll set a breakpoint like this and immediately continue, to see what I land on, but often I’ll use lldb’s breakpoint system as a quick way of searching the universe of symbol names. After setting a breakpoint like the one above, I’ll do a “break list” and then search through the results for other substrings I’m interested in. This often gives me a clue about the existence of methods or functions that are pertinent to the problem at hand.

I’ve scratched the surface here of all the powerful things you can use Xcode’s debugger console for, but I hope it has brought you some increased knowledge about the tools at your disposal. If you’ve never used the console before, or only use it occasionally, perhaps I’ve pushed you a bit farther down the path of having its Cmd-Shift-C shortcut feel like second-nature to you as well.

Share Extension Iterations

One of the many big surprises at WWDC this year was the news that iOS 8 and Mac OS X 10.10 would support app extensions, which give developers a variety of new ways in which data and services can be shared between apps.

One of these new types of extension, called a Share extension, essentially allows apps that generate user data provide content to apps that publish user data. As a developer whose main app, MarsEdit, is a blog-publishing tool for the Mac, you can imagine how this might be of interest to me.

The first thing I noticed upon digging into app extension development is that it’s fairly fiddly to get set up, and the default build, run, invoke iteration loop is fraught with administrative overhead.

First of all, when you add a Share extension target to an existing project, you’ll discover that the new target can’t be run directly. To test or debug it, you have to invoke the Share extension from some app that supports … sharing. There are many default apps on the Mac and iOS that support sharing data of various formats. For example on Mac OS X the system Preview app makes a canonical sharing source for photo data, while the Notes app is one of many suitable test apps for sharing text. If you don’t do anything special after adding a Share extension target to your project, the auto-generated Xcode scheme will be configured to ask every time you run:

ChooseAnApp

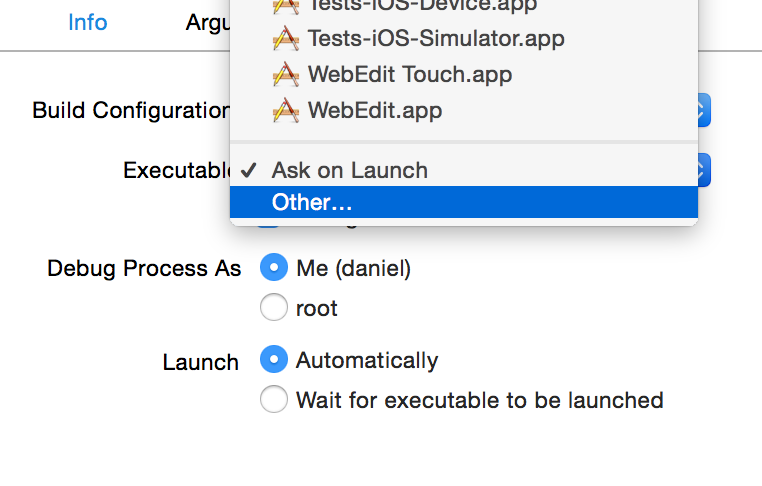
This will get old fast, and 99% of the time what you’ll want to run is exactly the same dang app you just ran. Luckily, this is easily addressed in the scheme settings, where you can change the “Executable” selection in the “Info” section of the “Run” tab from “Ask on Launch” to a specific application of your choosing.

OtherApp

That’s all well and good, but you still have to go through the tedious task of selecting some suitable content in the target app, clicking the share button, and choosing your extension from the list, before you even have the luxury of examining your own code’s behavior.

Wouldn’t it be great if you could make changes to your app extension’s appearance or behavior, click Run, and moments later be looking at your Share extension’s UI without having to do anything else? Good news: you can, and I’m about to explain how to achieve it for both Mac and iOS targets.

Automatic Invocation

The problem with all the targets on your Mac or iOS that may or may not support sharing pertinent data to your extension, is you have to walk them through the process of invoking you. When you’re deep into the development of a particular aspect of the user interface or mechanical behavior of your extension, what you really want is to repeatedly invoke the extension with the same, predictable kinds of data. Luckily, it’s possible on both Mac and iOS platforms for a host app to invoke sharing extensions programmatically, so you just need to choose a Run target that will predictably invoke your extension upon launching.

The only way I know to guarantee this is to write your own code that invokes the extension, and put it in a custom debugging-purposed target, or else put it into your main app as conditional code that only runs when building Debug variants and when prompted to take effect. I can imagine a sophisticated version of this approach involving a multi-faceted extension-debugging target that would be capable of fast-tracking extension invocation for a variety of data formats. But for the simplest solution, I recommend adding the ability to invoke your extension to the very app that hosts it. Then your simple test mode behavior will always coexist in the same source base as your extension code.

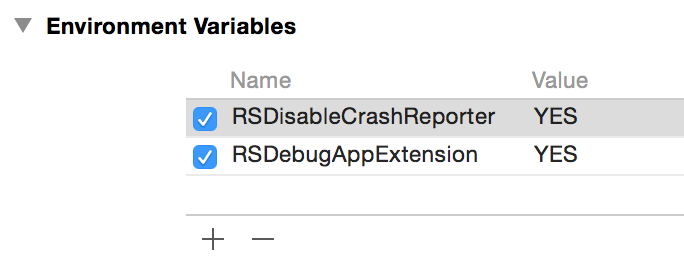
The way I approached this was to add an environment variable, “RSDebugAppExtension” to the scheme configuration for my app extension, which is also configured now to target the main app as its Executable target. So when I build and run the app extension scheme, may main app runs with these environment variables set:

Screenshot 11 24 14 3 12 PM

Now in the main app’s applicationDidFinishLaunching: method, I just have to add the appropriate code for invoking the app extension’s UI. Without the platform-specific voodoo, it looks something like this:

#if DEBUG
	// Check for flag to invoke app extension
	NSDictionary* env = [[NSProcessInfo processInfo] environment];
	NSString* appExtensionDebug = [env objectForKey:@"RSDebugAppExtension"];
	if (appExtensionDebug != nil)
	{
		// RUN MY EXTENSION
	}
#endif

The #if DEBUG just ensures that I will never inadvertenly ship this code in a release version of my app. The environment variable ensures I won’t be plagued by my extension’s UI appearing whenever I’m working on other aspects of my app besides the extension.

Now we just have to dig into the specifics of how to “RUN MY EXTENSION.” I’ll show you how that works for both Mac and iOS based Share extensions.

Invoking a Mac-based Share Extension

If you’re working on a Mac-based Share extension, the key to invoking it at runtime is to enlist the help of the NSSharingService infrastructure. You simply ask it for a service with your identifier, and ask it to “perform.”

NSString* serviceName = @"com.red-sweater.yeehaw";
NSSharingService* myService = [NSSharingService sharingServiceNamed:serviceName];
[myService performWithItems:@[@"Hello world"]];

Now when I build and run with the aforementioned environment variable set up, it pops up my Share extension, pre-populated with the text “Hello world.”

Invoking an iOS-based Share Extension

Unfortunately, iOS doesn’t support the same NSSharingService infrastructure that the Mac has. This seems like an area where we might be lucky to see more unification over the years, but for the time being the iOS notion of a sharing service is tied up with the existing “Social.framework” and its SLComposeViewController class. This is the interface that is supposed to be used to invoke a sharing panel for Facebook, Twitter, Tencent Weibo, etc. And luckily, although I don’t believe it’s documented, you can also pass in the extension identifier for your custom Share extension to instantiate a suitable view controller for hosting your extension:

NSString* serviceName = @"com.red-sweater.yeehaw";
SLComposeViewController* myController = [SLComposeViewController composeViewControllerForServiceType:serviceName];
[myController setInitialText:@"Hello World"];
[[self navigationController] presentViewController:myController animated:YES completion:nil];

You can see the basic gist of it is similar to the Mac, but you have to configure the view controller directly as opposed to providing a list of arbitrary input values. Also bear in mind that because the iOS-based solution above relies upon [self navigationController] being non-nil, you’ll need to add the special debugging code at a point in your app’s launch process when this is already set up, or else find another way of ensuring you can meaningfully present view controllers to your app’s main window.

Going Further

Notice that I hinge all the invocation on simply whether the RSDebugAppExtension environment variable is non-nil. Basically while I’m debugging I have to go in and change the code in applicationDidFinishLaunching to invoke the extension in the way I want. This works OK for me at least at this stage, but I can imagine down the road wanting to be able to fine-tune the behavior of how the extension is invoked. For this purpose, why not encode into the value of the environment variable itself certain clues about how to invoke the extension? It could specify for example what text should be passed the extension, or other configuration as desired.

My intent in sharing this blog post is both to point out some potentially time-saving tricks that will help those of you developing Share app extensions, but also to encourage you to look for creative ways to cut out the tedious aspects of whatever you work on. When all is said and done, the few monotonous steps during each iteration of work on a Share extension probably don’t add up to all that much in sheer time, but they take a lot of the joy and immediacy out of development, which frankly puts me in a bad mood. Clicking Run and seeing my work, including my latest changes, pop up instantly on the screen makes me feel a lot happier about my job.

Bridging iOS WebViews

I hinted in my previous post that similar techniques could be used to bridge JavaScript to Objective-C on iOS, but that it would require using undocumented methods. As with the Mac-based solution, it’s not such a big deal so long as you’re only going to use it for private, debugging builds of your app. So how can it be done?

WebKit on iOS is for the most part famously, frustratingly hidden from developer use. As apps like Safari show, there is an extensive, powerful WebKit framework just as there is on the Mac, but iOS developers are limited to the comparatively impotent UIWebView.

But here’s a hint: UIWebView is itself a client of “proper WebKit,” and thus implements many of the powerful delegate methods that you would implement as the Mac delegate of a WebView. So if I were an iOS developer and wanted to play around with bridging WebView to Objective-C, I would simply subclass UIWebView, and override the delegate methods methods I am interested in:

#if DEBUG
@interface UIWebView (PrivateMethods)
- (void)webView:(UIWebView*)webView
      didClearWindowObject:(id)windowObject
      forFrame:(id)frame;
@end

@interface MyWebView : UIWebView
@end

@implementation MyWebView

// Override methods on UIWebView that it itself employs
// as delegate of a "proper" WebKit WebView object
- (void)webView:(UIWebView*)webView
      didClearWindowObject:(id)windowObject
      forFrame:(id)frame
{
   [super webView:webView didClearWindowObject:windowObject forFrame:frame];

   id myDelegate = [[UIApplication sharedApplication] delegate];
   [windowObject setValue:myDelegate forKey:@"appDelegate"];
}

@end

#endif

Set your WebView to use the custom class “MyWebView”, and now your iOS-based WebView can pass whatever information it needs to directly to your delegate, just as I illustrated for the Mac version.

JavaScript Bug Traps

I am the kind of developer who leans heavily on automated systems for the improvement of my code. For this reason I tend to enable the maximum number of warnings, rely upon static analysis to discover nuanced bugs, develop and run unit tests to automatically confirm expected behaviors, and I encourage my apps to crash hard if they are going to crash at all.

I would characterize all of these behaviors as part of an overall attitude of vigilance against software defects. Learning about problems in code quickly and clearly is a key step maintaining an overall high level of code quality.

Most of my software is developed in Objective-C, which enables me to leverage compile-time and run-time tools from Apple that catch my errors quickly. Between compile-time warnings and errors, and runtime exceptions and crashes, the vast majority of my programming errors in Objective-C are caught within minutes of writing them.

On the other hand, MarsEdit features a rich HTML text editor largely implemented in JavaScript, a language which tends not to afford any of these convenient alerts to my mistakes. I have often stared in bewilderment at the editor window’s perplexing behavior, only to discover after many lost minutes or hours, that some subtle JavaScript error has been preventing the expected behavior of my code. I’ll switch to the WebKit inspector for the affected WebView, and discover the console is littered with red: errors being dutifully logged by the JavaScript runtime, but ignored by everybody.

Wouldn’t it be great if the JavaScript code crashed as hard as the Objective-C code does?

In fact, these days mine does. By a combination of JavaScript hooks that are alerted to the errors, Objective-C bridges that propagate them to the host app, and the judicious use of undocumented WebKit Inspector methods, development versions of my WebView-based apps now automatically present an inspector window the moment any error occurs in the view’s underlying JavaScript code.

For those of you who also develop JavaScript-heavy WebKit apps, I’ll share the steps for enabling this same type of behavior in your app. These steps all apply to Mac-based WebViews, but most of the same techniques could be used with iOS if you are willing to use some private methods to establish a bridge between the WebView and host app (for debug builds only, of course).

Step 1: Catch the error in JavaScript.

In whatever the main source content is for your WebView-based user interface, add some script code to register a callback for JavaScript errors:

<script type="text/javascript">
   function gotJavaScriptError(errorEvent)
   {
      console.log("Error: " + errorEvent.message);
   }

   window.addEventListener("error", gotJavaScriptError,  false);
</script>

Now if you encounter some error and happen to be attached with the web inspector, you’ll see additional confirmation that the error has in fact been noticed. if you’re following along in your own code while you read, I strongly encourage you to add a testing mechanism for generating errors. A simple “click” event callback (or “touchstart” on iOS) does the trick well:

<script type="text/javascript">
   function gotClick(theEvent)
   {
      blargh
   }

   window.addEventListener("click", gotClick, false);
</script>

Now when you click, you blargh. And when you blargh, the error is logged. Of course, just logging the error isn’t very useful because it’s quiet and goes ignored. Just like JavaScript errors usually do…

Step 2: Propagate the error to the host app.

You could do some interesting stuff in the WebView itself. For example you might convert the error into a string and display a prominent alert message. But since there’s so much more you can do once the host app is in charge, it’s worth going the extra mile for that functionality.

To tie the host app to the WebView we need to wait for the WebView’s frame to finish preparing its “window script object,” and then set a named attribute on that object that refers to an Objective-C instance. See that your WebView has a frameLoadDelegate configured, and within that delegate object implement this method:

- (void)webView:(WebView *)webView 
        didClearWindowObject:(WebScriptObject *)windowObject
        forFrame:(WebFrame *)frame
{
   // Expose ourselves as a JavaScript window attribute
   [[webView windowScriptObject] setValue:self forKey:@"appDelegate"];
}

At this point any JavaScript code, including our error-handling callback, can reference the Objective-C delegate directly. But in order to make good use of the delegate we’ll have to add a couple other methods. The first lets the WebKit runtime know that we are not fussy about which of our methods are accessible to the WebView:

+ (BOOL) isSelectorExcludedFromWebScript:(SEL)aSelector
{
   return NO;
}

Now JavaScript code within the WebView can call any method it chooses on the delegate object. Implement something suitable for catching the news of the JavaScript error:

- (void) javaScriptErrorOccurred:(WebScriptObject*)errorEvent
{
   NSLog(@"WARNING JavaScript error: %@", errorEvent);
}

And back in your WebView HTML source file, amend the JavaScript error handler to call through to Objective-C instead of pointlessly logging to the JavaScript console:

<script type="text/javascript">
   function gotJavaScriptError(errorEvent)
   {
      console.log("Error: " + errorEvent.message);
      window.appDelegate.javaScriptErrorOccurred_(errorEvent);
   }

   ...
</script>

Notice that the colons in Objective-C method names are simply replaced with underscores to make them compatible with the JavaScript function naming rules. The errorEvent argument in this case is translated to a DOMEvent object instance in Objective-C, where it can be further interrogated. Alternatively you could pull the parts of the event you want out in JavaScript, and pass along only those bits.

Now we’ve done a considerable amount of work, only to upgrade our easy to ignore JavaScript errors from littering the web console to littering the system console. At least we’d notice these errors in the Xcode debugger console, and might eventually get around to taking a closer look. But we can still do much better.

Step 3: Get face to face with the error.

Of course from Objective-C there are any manner of ways you could handle the error. In a shipping app it might make sense to prompt the user with news of the issue and offer, much like a crash reporter would, to send information about the error to you. Or if the contents and behavior of your WebView are critical enough, maybe it’s worth forcing the app to quit just as it would for a native code crash. But for debugging builds I’ve find it very helpful simply to have the error force the Web Inspector open so I am no longer able to quietly ignore all the red console logging. In the delegate class, go back to the javaScriptErrorOccurred: method and replace the NSLog call with this string of fancy mumbo-jumbo

- (void) javaScriptErrorOccurred:(id)errorEvent
{
#if DEBUG
   id inspector = [[self webView] performSelector:@selector(inspector)];
   [inspector performSelector:@selector(showConsole:) withObject:nil];
#endif
}

That’s it. Now when you run into a WebView-based JavaScript error, the web inspector appears and the list of pertinent errors is front-and-center.

I encourage you to leave the DEBUG barrier in place, because as the prolific use of “performSelector” may suggest, these are private WebKit methods that would probably not be viewed as acceptable by e.g. App Store reviewers. Anyway, you probably don’t want customers being pushed into the Web Inspector.

I hope this technique proves useful for those of you with extensive JavaScript source bases of your own. For everybody else, perhaps I’ve helped to drive home the idea that we should be as vigilant as possible against software defects. All developers write bugs, all the time. It’s only fair that we try to balance the scales and give ourselves a fighting chance by also being alerted to the bugs we write, all the time.

F-Script Anywhere With LLDB

Ever since the start of my career at Apple, working with the venerable Macsbug, I have prided myself on making the most of whatever debugging facilities are at my disposal. I came to be quite capable with Macsbug, adding custom commands and data templates that helped me speed through crucial debugging sessions that would have otherwise taken much longer.

When I moved from the classic Mac OS team to Mac OS X, I was forced, only slightly earlier than every other Mac developer, to adapt to gdb. I did so with modest aplomb, adding custom commands that made it easy to, for example, continue until the next branch instruction (as it happens, also the first real post on the Red Sweater Blog).

When Apple started shifting away from gdb to lldb a few years ago, I realized I would have to throw out all my old tricks and start building new ones. To my great shame, progress on this front has been slower than I wished. The shame is made greater by the fact that lldb is so delightfully extensible, it practically begs for a nerd like me to go town adding every manner of finessing to suit my needs.

The nut of lldb’s extensibility is that much of its functionality is actually implemented in Python, and developers such as ourselves are invited to extend that functionality by providing Python modules of our own.

I finally decided to break the ice with lldb’s extensibility by adding a shortcut command for something I often want to do, but frequently put off because it’s too cumbersome: injecting F-Script into an arbitrary application running on my Mac. F-Script is a novel dynamic programming interface that lets you query the runtime of a Cocoa app using a custom language. It also features a handy tool for drilling down into an app’s view hierarchy and then navigating the various superviews and subviews, along with all their attributes. In some respects it’s very similar to a “web inspector,” only for native Objective-C applications on the Mac (and sadly, with far fewer features).

There are Automator workflows that aim to automate the process of injecting F-Script into a target app, by running the required commands, via gdb or lldb, to make the injection work seamlessly. For some reason, these workflows have never worked so seamlessly for me, so I’m always reduced to attaching to the process with lldb, and running the required commands manually to get the framework loaded.

Fortunately for me, “having to run lldb” is not such a big deal. Usually when I want to poke around at an app, I’m in lldb anyway, trying to break on a specific function or method, or examining the application’s windows and views via the command line. Once I’m attached to a process with lldb, getting F-Script to inject itself is as easy as running these two commands:

expr (void) [[NSBundle bundleWithPath:@"/Library/Frameworks/FScript.framework"] load]
expr (void) [FScriptMenuItem insertInMainMenu]

That’s all well and good but to do that I always have to find the memo I took with the specific commands, then copy and paste them individually into lldb. Far too often, I wind up imagining the struggle of this work and put it off until I’ve spent minutes if not hours doing things “the harder way” until I finally relent and load F-Script.

Today I decided that I need to stop manually copying and pasting these commands, and I need to finally learn the slightest bit about lldb’s Python-based script commands. The fruit of this effort is summarized in this GitHub gist. Follow the directions on that link, and you’ll be no further away than typing “fsa” in lldb from having all of its utility instantly injected into the attached app from lldb.

Even if you’re not interested in F-Script Anywhere, the gist is a concise example of what it takes to install a simple, Python-backed macro command into lldb. Enjoy!

Brent’s Coding Nits

I agree with every one of Brent Simmons’s coding nits, even if I don’t practice what he preaches completely. Everybody has to make some mistakes to keep life interesting, right?

There’s also one point he makes:

All of your class names should have a prefix. All of them.

Which I think is particularly applicable to shared code such as the kind he’s reviewing on GitHub when compiling this list of nits. It’s not nearly so important, and in fact not really that important at all, for a project’s private classes to have prefixes. For example if you make a new app called “Motorcycle Derby,” you should be forgiven for calling your app’s delegate class “AppDelegate.m” if that is what suits you. By this point in history, Apple takes virtual namespacing seriously enough that you’re unlikely to clash with an unprefixed name from them, and so long as everybody distributing shared library code follow’s Brent’s rule above, you won’t clash with them either.

Still, you can’t go wrong by adding prefixes to be extra sure that you won’t conflict with anybody.