All posts by Daniel Jalkut

Swift Integration Traps

In the nearly four years since Swift was announced at WWDC 2014, Mac and iOS developers have embraced the language with decreasing reluctance. As language features evolve, syntax stabilizes, and tooling improves, it’s easier than ever to leap into full-fledged Swift development.

Several months ago, I myself made this leap. Although the vast majority of my Mac source base consists of Objective-C files, I have enjoyed adding new source files in Swift, and even converting key files to Swift either as an exercise, or when I think I will gain specific advantages.

One remaining challenge in Swift is the lack of ABI stability. In layperson’s terms: the lack of ABI stability prevents compiled Swift code from one version of the Swift compiler and runtime from linking with and running in tandem with Swift code compiled for another version.

For most developers, this limitation simply means that the entire Swift standard library, along with glue libraries for linking to system frameworks, needs to be bundled with the application that is built with Swift. Although it’s a nuisance that several megabytes of libraries must be added to every single Swift app, in the big scheme of things, it’s not a big deal.

A worse consequence is the number of pitfalls that ABI instability present, that are difficult to understand intuitively, and in many cases impossible, or at least dangerous, to work around. These pitfalls lie mainly in areas where developer code is executed on behalf of a system service, in a system process. In this context, it is not possible for developers to ensure that the required version of Swift libraries will be available to support their code. Game over.

On the Mac, system integration plugins are a typical scenario for this problem. While iOS has evolved with a strong architecture for running developer code in standalone, sandboxed processes, on the Mac there are still many plugins that run in a shared system process alongside code from other developers. These plugins run the gamut from arcane, rarely used functionality, to very common, user-facing features where a plugin is effectively required in order to satisfy the platform behaviors prescribed by Apple and expected by end-users.

One example on the more arcane, or at least inessential, end of the spectrum, is the Screen Saver plugin interface. Create a new project in Xcode, and choose the “Screen Saver Plugin” template as your starting point. Notice how unlike most templates, Xcode doesn’t even offer a choice of language. Your source files will be Objective-C. At least they’re giving you a hint here.

On the more mainstream end of the spectrum are plugins such as System Preferences panels and QuickLook Plugins. Depending on the type of app you are developing, it may be essential, or at least very well-advised to implement one of these types of plugins. So what do you do if you have an existing Objective-C app that you want to port to Swift, or you are writing a Swift app from scratch, and need to support one of these plugin formats? In the case of System Preferences panels at least, you have a couple practical options:

  1. Implement the plugin code, and all supporting code in Objective-C.
  2. Move the functionality out of System Preferences and into the host app.

Each of these could be somewhat reasonable approaches for a System Preferences plugin. The content of these plugins is often fairly straightforward, standard UI, and the goal is usually to collect configuration data to convey to the host application. It’s also not unreasonable, and may even be preferable to move such configuration code out of System Preferences and into a native panel inside the host app.

QuickLook Plugins are another beast. Because the goal of a QuickLook Plugin is usually to convey a visual depiction of a native document type, it’s exceedingly common to take advantage of the very classes that present the document natively in the host app. Let’s say you’ve written an app in Swift, FancyGraphMaker. Apple encourages you to implement a QuickLook Plugin so that users will be able preview the appearance of your fancy graphs, both in the dedicated QuickLook interface, and by way of more unique looking icons in the Finder.

But once you’ve written the code to draw those fancy graphs in Swift, you’re locked out of using that code from a QuickLook Plugin. Worse? Finishing touches such as supporting Quick Look are liable to come later in the development of an app, so you’ve probably gone through the decision-making process of writing your app in Swift, before realizing that the decision effectively cuts you off from a key system feature. That’s a Swift Integration Trap.

Although the workarounds are not as straight-forward in this scenario as they are for a System Preferences pane, it is probably still technically possible to leverage Swift code in the implementation of a QuickLook Plugin. I have not tested this, but I imagine such a plugin could spawn an XPC process that is itself implemented in Swift and executes the bulk of the preview-generation work on behalf of the system-encumbered plugin code. The XPC process would be free to link to whatever bundled Swift libraries it requires, generate the desired preview data, and message it back to the host process. At least, I think that would work.

But I shouldn’t have to think that hard to get this to work, nor should any other developer. The problem with these Swift Integration Traps is twofold:

  1. If you don’t know about them, you end up stuck, potentially regretting the decision to move to Swift.
  2. If you do know about them, you might put off adopting Swift completely, or at least put off converting classes that are pertinent to QuickLook preview generation.

Each of these consequences is bad for developers, for users, and for Apple. Developers face a trickier decision process about whether to move to Swift, users face potential integration shortcomings for Swift-based apps, and Apple suffers either reduced adoption of Swift, reduced integration with system services, or both.

I filed Radar #38792518 requesting that QuickLook Plugins be supported by the App Extension model. Essentially, this would formalize the process of putting the generation code in a separate XPC process, as I speculated above would work around the problem. The App Extension system is designed to support, and in fact requires this approach. The faster Apple moves QuickLook Plugins, and other shared-process plugins to the App Extension model, the fast developers can embrace Swift with full knowledge that their efforts to integrate with the system will not be stymied.

Update: Thanks to a hint from Chris Liscio, I have learned that Apple has in fact made some progress on the QuickLook front, but it won’t help the vast majority of cases in which a QuickLook Plugin is used to provide previews for custom file types. It took me a while to hunt this down because it not very clearly documented, and Google searches do not lead to information about it.

At WWDC 2017, Apple announced support for a new QuickLook Preview Extension. It escaped my notice even while ardently searching for evidence of such a beast, because the news was shared in the What’s New in Core Spotlight session. Making matters worse, the term “QuickLook” does not appear once in the session transcript, although it turns out that “Quick Look” appears many times:

Core Spotlight is also coming to macOS and just like on iOS you can customize your preview. On macOS a preview is shown when you select a search result in the Spotlight window. Here you really do want to implement a Quick Look preview extension for your Core Spotlight item because Spotlight on macOS does not have a default preview.

Ooh, this sounds exciting! I’ve wondered over the years why such similar plugins, Spotlight importers, and QuickLook generators, shouldn’t be unified. Although the WWDC presentation emphasizes substantial parity in behavior for QuickLook Previews between iOS and macOS, there is a major gotcha:

Core Spotlight is great for databases and shoeboxes where your app has full control over the contents.
It’s not for items that the user monitors in the finder, for that the classic Spotlight API still exists and still works great.

I beg to differ with that “still works great” assessment, at least in the context of this post. Mac developers who want to integrate with QuickLook must still use a shared-process plugin. It’s still a Swift Integration Trap.

IDEBundleInjection Signing Failure

When a unit test bundle is built to be dynamically injected into a host app, Xcode performs a little dance at build time, in which it adds its own IDEBundleInjection.framework to the bundle, then re-signs it with the developer’s code signing identity.

Normally this all goes off without a hitch, but today when I went to build and test such a bundle, I was met with a rude code signing failure:

IDEBundleInjection.framework: unsealed contents present in the root directory of an embedded framework

I took all the usual steps when facing an obtuse error: clean the build directory, quit and restart Xcode, etc. Nothing fixed it, so I thought perhaps it was an issue with the 9.3 beta Xcode I was running. Nope. Same problem with 9.2. Finally, I made my own copy of the framework in question, and ran “codesign” against it myself from the Terminal. Same error!

This framework, stored within Xcode itself, has become unsignable. Running “codesign -v” against the framework in place also confirms that the code signing seal has been broken. What happened to my Xcode?

It occurred to me that I recently migrated from one Mac to another, and copied my Xcode when I did. I tried to use the Apple-standard migration assistant, but it failed, so I ended up using Finder, or ditto from the Terminal, to copy everything over. Maybe something was messed up in the transition?

The codesign utility is useful for letting me know that something is wrong, but doesn’t actually do me the favor of telling me what it is! Luckily, I have a backup of my whole disk and the original Xcode on that volume appear to have properly signed internal frameworks. Running a diff on IDEBundleInjection.framework between the two copies, I do see some reported distinctions. Where “.” is the current, misbehaving framework:

Only in .: .BC.D_QdfhyO
Only in .: .BC.D_mgLUu2
Only in ./Versions: .BC.D_gSVCxT

These appear to be redundant cruft correlating to the expected internal version links. For every link like:

IDEBundleInjection -> Versions/Current/IDEBundleInjection

I have one of these unexpected garbage links. The presence of these links are, of course, detected by codesign, and it throws everything off.

I don’t know why these mysterious gremlin files showed up on my Mac, but whatever the cause, there’s an easy solution. I’m taking a leap of faith that I don’t actually want any of these files:

cd /Applications/Xcode.app
find . -name ".BC.*" -delete

And now I can get back to unit testing my app.

Xcode’s Secret Performance Tests

I was inspired today, by a question from another developer, to dig into Xcode’s performance testing. This developer had observed that XCTestCase exposes a property, defaultPerformanceMetrics, whose documentation strongly suggests can be used to add additional performance metrics:

This method returns XCTPerformanceMetric_WallClockTime by default. Subclasses of XCTestCase can override this method to change the behavior of measureBlock:.

If you’re not already familiar, the basic approach to using Xcode’s performance testing infrastructure is you add unit tests to your project that wrap code with instructions to measure performance. From the default unit test template:

func testPerformanceExample() {
	// This is an example of a performance test case.
	self.measure {
		// Put the code you want to measure the time of here.
	}
}

Depending on the application under test, one can imagine all manner of interesting things that might be useful to tabulate during the course of a critical length of code. As mentioned in the documentation, “Wall Clock Time” is the default performance metric. But what else can be measured?

Nothing.

At least, according to any header files, documentation, WWDC presentations, or blunt Googling that I have encountered. There is exactly one publicly documented Xcode performance testing metric, and it’s XCTPerformanceMetric_WallClockTime.

I was curious whether supporting additional, custom performance metrics might be possible but under-documented. To test this theory, I added “beansCounted” to the list of performance metrics returned from my XCTestCase subclass. For some reason I couldn’t get Swift to accept the XCTPerformanceMetric pseudo-type, but it allowed me to override as returning an array of String:

override static func defaultPerformanceMetrics() -> [String] {
	return ["beansCounted"]
}

When I build and test, this fails with a runtime exception “Unknown metric: beansCounted”. The location of an exception like this is a great clue about where to go hunting for information about whether an uknown metric can be made into a known one! If there’s a trick to implementing support for my custom “beansCounted” metric, the answer lies in the method XCTestCase’s “measureMetrics(_: automaticallyStartMeasuring: forBlock:)”, which is where the exception was thrown.

By setting a breakpoint on this method and stepping through the assembly in Xcode, I can watch as the logic unfolds. To simplify what happens: first, a list of allowable metrics is computed, and then the list of desired metrics is iterated. If any metric is not in the list? Bzzt! Throw an exception.

I determined that things are relatively hardcoded such that it’s not trivial to add support for a new metric. I was hoping I could implement some magic methods in my test case, like “startMeasuring_beansCounted” and “stopMeasuring_beansCounted”

but that doesn’t appear to be the case. The performance metrics are supported internally by a private Apple class called XCTPerformanceMetric, and the list of allowable metrics is derived from a few metrics hardcoded in the “measureMetrics…” method:

  • “com.apple.XCTPerformanceMetric_WallClockTime”
  • “com.apple.XCTPerformanceMetric_UserTime”
  • “com.apple.XCTPerformanceMetric_RunTime”
  • “com.apple.XCTPerformanceMetric_SystemTime”

As well as a bunch of others exposed by a private “knownMemoryMetrics” method:

  • “com.apple.XCTPerformanceMetric_TransientVMAllocationsKilobytes”
  • “com.apple.XCTPerformanceMetric_TemporaryHeapAllocationsKilobytes”
  • “com.apple.XCTPerformanceMetric_HighWaterMarkForVMAllocations”
  • “com.apple.XCTPerformanceMetric_TotalHeapAllocationsKilobytes”
  • “com.apple.XCTPerformanceMetric_PersistentVMAllocations”
  • “com.apple.XCTPerformanceMetric_PersistentHeapAllocations”
  • “com.apple.XCTPerformanceMetric_TransientHeapAllocationsKilobytes”
  • “com.apple.XCTPerformanceMetric_PersistentHeapAllocationsNodes”
  • “com.apple.XCTPerformanceMetric_HighWaterMarkForHeapAllocations”
  • “com.apple.XCTPerformanceMetric_TransientHeapAllocationsNodes”

How interesting! There are a lot more metrics defined than the single “wall clock time” exposed by Apple. So, should we use them? Official answer: no way! This is private, unsupported stuff, and can’t be relied upon. Punkass Daniel Jalkut answer? Why not? They’re your tests, and your the only one who will get hurt if they suddenly stop working. In my opinion taking advantage of private, undocumented system behavior for private, internal gain is much different than shipping public software that relies upon such undocumented behaviors.

I modified my unit test subclass to return a custom array of tests based on the discoveries above, just to test a few:

override static func defaultPerformanceMetrics() -> [String] {
	return [XCTPerformanceMetric_WallClockTime, "com.apple.XCTPerformanceMetric_TransientHeapAllocationsKilobytes", "com.apple.XCTPerformanceMetric_PersistentVMAllocations", "com.apple.XCTPerformanceMetric_UserTime"]
}

The tests build and run with no exception. That’s a good sign! But these “secret peformance tests” are only useful if they can be observed and tracked the way the wall clock time can be. How does Xcode hold up? I made my demonstration test purposefully impactful on some metrics:

func testPerformanceExample() {
	self.measure {
		for _ in 1..<100 {
			print("wasting time")
		}
		let _ = malloc(3000)
	}
}

Now when I build and test, look what shows up in the Test navigator’s editor pane:

Screenshot of performance metrics after reducing the size of allocations and length of run.

Look at all those extra columns! And if I click the “Set Baselines…” button, then tweak my function to make it substantially less performant:

func testPerformanceExample() {
	self.measure {
		for _ in 1..<10000 {
			print("wasting time")
		}
		let _ = malloc(300000)
	}
}

Now the columns have noticably larger numbers:

Screenshot of Xcode's test results after running tests with

But more importantly, the test fails:

Screenshot of test errors generated by failing to meet performance baselines.

I already mentioned that by any official standard, you should not take advantage of these secret metrics. They are clearly not supported by Apple, may be inaccurate or have bugs, and could outright stop working at any time. I also said that, in my humble opinion, you should feel free to use them if you can take advantage of them. The fact that they are supported so well in Xcode probably implies that groups internal to Apple are using them and benefiting from them. Your mileage may vary.

The only rule is this: if Apple does do anything to change their behavior, or you otherwise ruin your day by deciding to play with them, you shouldn’t blame Apple, and you can’t blame me!

Enjoy.

Accessible Frames

I love the macOS system-wide dictionary lookup feature. If you’re not familiar with this, just hold down the Control, Command, and D keys while hovering with the mouse cursor over a word, and the definition appears. What’s amazing about this feature is it works virtually everwyhere on the system, even in apps where the developers made no special effort to support it.

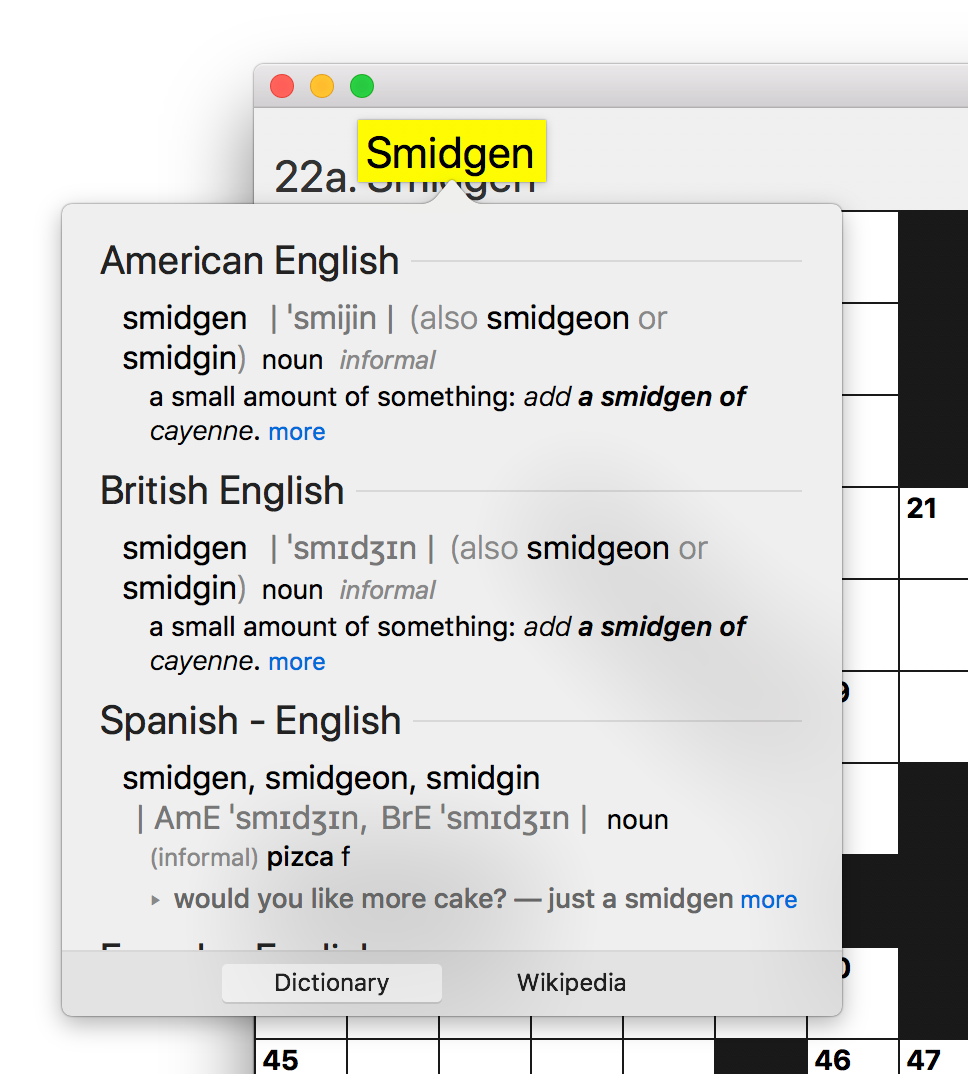
Occasionally, while solving a crossword puzzle in my own Black Ink app, I use this functionality to shed some light on one of the words in a clue. As alluded to above, it “just works” without any special work on my part:

Screen shot of Black Ink's interface, with a highlighted word being defined by macOS system-wide dictionary lookup.

Look carefully at the screenshot above, and you can see that although the dictionary definition for “Smidgen” appears, it seems to have highlighted the word in the wrong location. What’s going on here?

The view in Black Ink that displays the word is a custom NSTextField subclass called RSAutosizingTextField. It employs a custom NSTextFieldCell subclass in order to automatically adjust the font size and display position to best “fill up” the available space. In short: it behaves a lot like UITextField on iOS.

To achieve this behavior, one of the things my custom cell does is override NSTextFieldCell’s drawingRect(forBounds:). This allows me to take advantage of most of NSTextField’s default drawing behavior, but to nudge things a bit as I see fit. It’s this mix of customized and default behaviors that leads to the drawing bug seen above. I’ve overridden the drawing location, but haven’t done anything to override the content hierarchy as it’s reflected by the accessibility frameworks.

What do the accessibility frameworks have to do with macOS system-wide dictionary lookup? A lot. Apparently it’s the “accessibilityFrame” property that dictates not only where the dictionary lookup’s highlighting will be drawn, but also whether the mouse will even be considered “on top of” a visible word or not. So in the screenshot above, if the mouse is hovering over the lower half of the word “Smidgen”, then the dictionary lookup doesn’t even work.

The fix is to add an override to NSTextField’s accessibilityFrame method:

public override func accessibilityFrame() -> NSRect {
	let parentFrame = super.accessibilityFrame()
	guard let autosizingCell = self.cell as? RSAutosizingTextFieldCell else { return parentFrame }

	let horizontalOffset = autosizingCell.horizontalAdjustment(for: parentFrame)

	// If we're flipped (likely for NSTextField, then the adjustments will be inverted from what we
	// want them to be for the screen coordinates this method returns.
	let flippedMultiplier = self.isFlipped ? -1.0 as CGFloat : 1.0 as CGFloat
	let verticalOffset = flippedMultiplier * autosizingCell.verticalAdjustment(for: parentFrame)

	return NSMakeRect(parentFrame.origin.x + horizontalOffset, parentFrame.origin.y + verticalOffset, parentFrame.width, parentFrame.height)
}

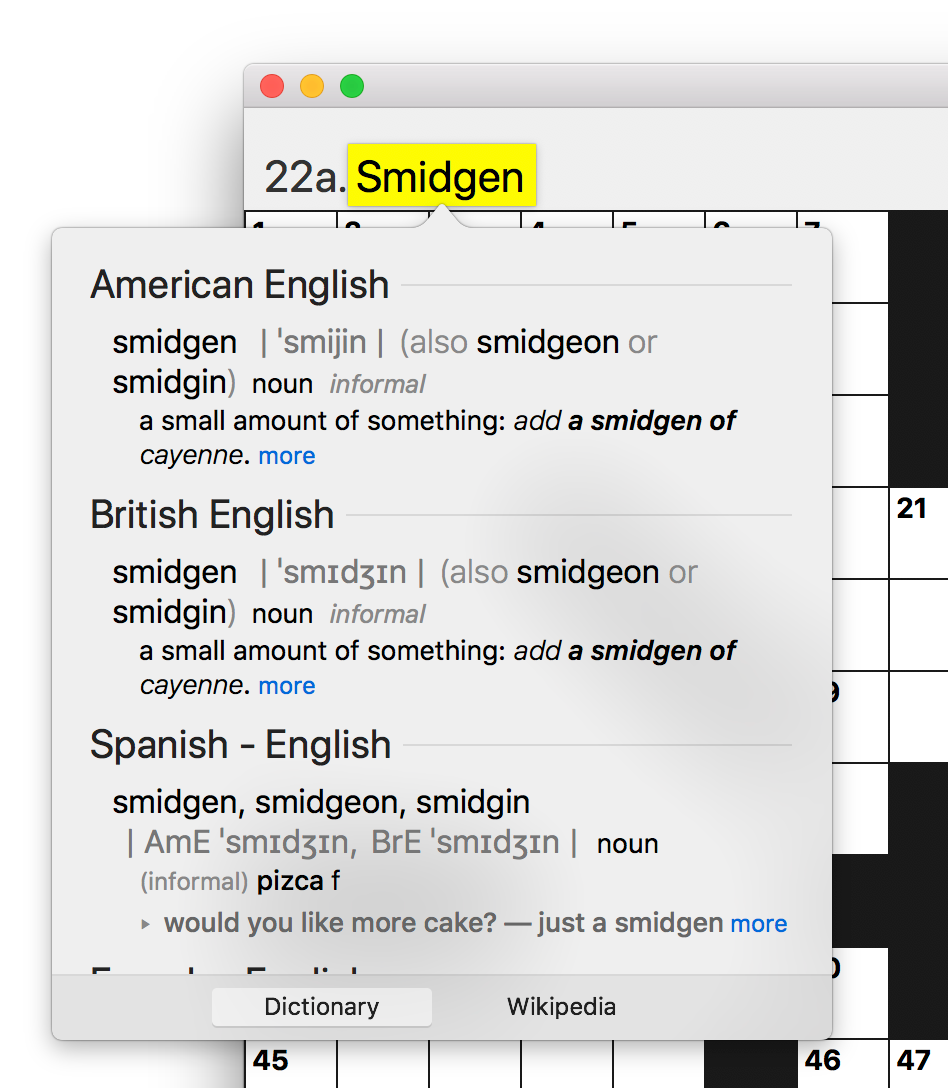
Effectively I take the default accessibility frame, and nudge it by the same amount that my custom autosizing text cell is nudging the content during drawing. The result is only subtly difference, but makes a nice visual refinement, and a big improvement to usability:

Screen shot of dictionary lookup UI with properly aligned word focus.

I thought this was an interesting example of the accessibility frameworks being leveraged to provide a service that benefits a very wide spectrum of Mac users. There’s a conventional wisdom about accessibility that emphasizing the accessibility of apps will make the app more usable specifically for users who take advantage of screen readers and other accommodations, but more generally for everybody who uses the app. This is a pretty powerful example of that being the case!

Playground Graphs

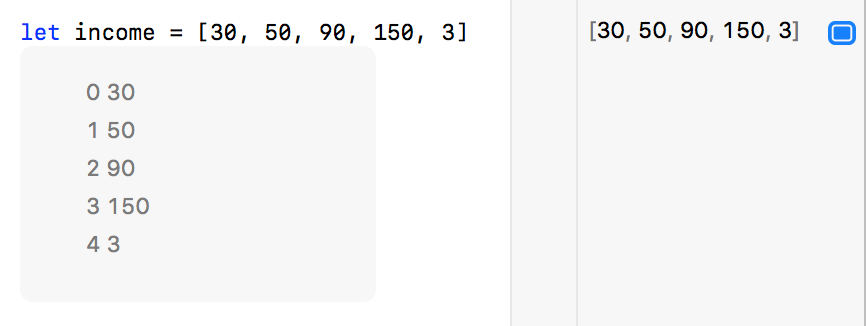
I was playing around with the Swift standard library’s “map” function, when I noticed a cool feature of Xcode Playgrounds. Suppose you are working with an array of numbers. In the Xcode Playgrounds “results” section, you can either click the Quick Look “eye” icon, or click the little results rectangle to get an inline results view of the expression you’re viewing:

Screenshot of Xcode Playgrounds's inline results view, revealing the values of an array of numb ers.

The linear list of values is revelatory and easy to read, but wouldn’t it be easier to understand as a graph? It turns out simply passing these values through the map function does just that:

Screenshot of the Xcode Playgrounds's result of the map function when returning numeric values.

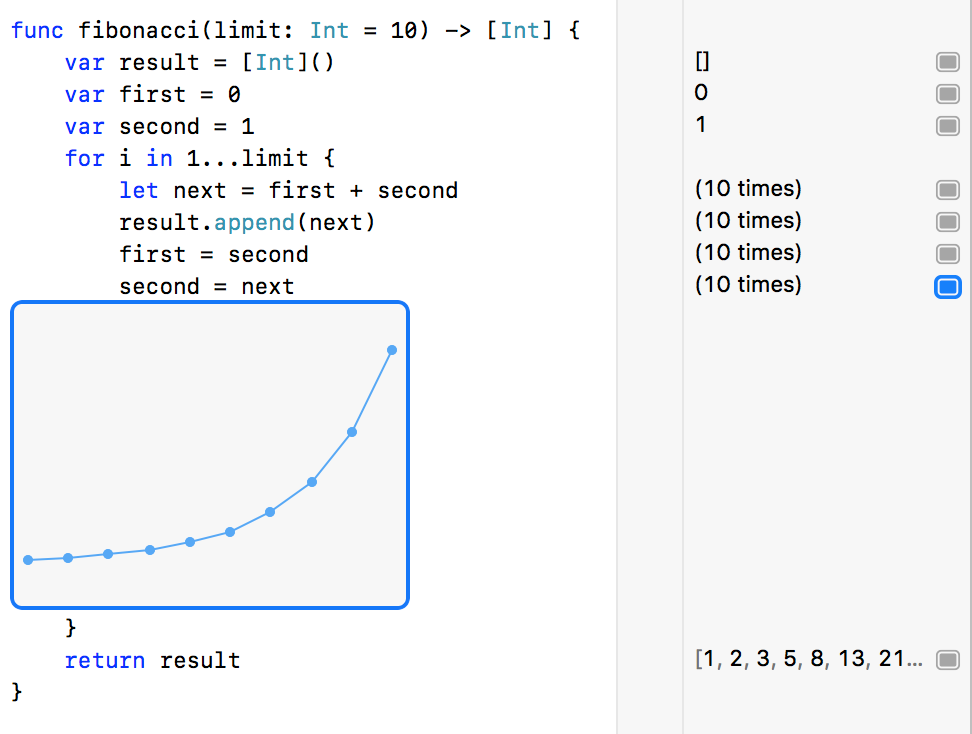
I thought I had stumbled on some magical secret of Xcode, but it turns out the behavior is well documented, and applies to more than just the “map” function. You can even grab the edges of the result view and resize it to better suit your data. In fact, any looping numeric value seems to trigger the availability of this handy graphing functionality:

Screenshot of Xcode Playgrounds showing a graph of the results of Fibonacci sequence.

I am still frustrated by a lot of behaviors of Xcode Playgrounds, but little gems like these are nice to stumble upon.

Unified Swift Playgrounds

The announcement of Swift Playgrounds 2.0 has me thinking again about Xcode Playgrounds: both about what a revelation they are, and about how disappointing they continue to be.

When Xcode Playgrounds were first introduced (as “Swift Playgrounds”) in 2014, they were received as a groundbreaking new way for developers to write Swift code interactively. There were lots of rough edges on the feature, but it seemed reasonable to expect that because they were released in tandem with the Swift programming language itself, those rough edges would be smoothed out on a parallel pace with the language itself.

Two years later, Apple announced Swift Playgrounds again, immediately introducing a nomenclature confusion. This time the name referred to a dedicated, closed-source iOS app designed for interactively teaching programming concepts with Swift. The previous Xcode-coupled technology, now known as “Xcode Playgrounds” or simply “Playgrounds,” had seen modest improvements over the years but continued to be frustratingly slow, unpredictable, and crash-prone.

Today, in early 2018, the release of Swift Playgrounds 2.0 for iOS appears to represent Apple’s commitment to driving that product forward into the future. The latest version of Xcode Playgrounds, on the other hand, offers a lackluster interface, slow responsiveness, and a tendency to crash both within the Playground, and in ways that take down the entire Xcode app. In short: they’re not a very fun place to play.

I propose that Apple eliminate Xcode playgrounds, and invest all of their work in the field of interactive coding into the Swift Playgrounds app. It has been a nagging shortcoming that Swift Playgrounds is only available for iOS. Many people who would benefit from the educational opportunities of Swift Playgrounds could do so from Macs, whether in schools, homes, or workplaces. Porting Swift Playgrounds to the Mac would address that problem.

Where does that leave developers? After eliminating Xcode Playgrounds as we know them today, I envision adapting the Mac version of Swift Playgrounds so that playgrounds can be run either independently in a Swift Playgrounds app, or in “developer mode” within Xcode. In effect, Xcode would become a dedicated Swift Playgrounds authoring app, where such authoring capabilities would incidentally provide all the benefits that standalone Xcode Playgrounds currently provide.

Taking this course would allow Apple to maximize the output of its engineering and design efforts while eliminating the naming confusion that currently exists between Swift Playgrounds and Xcode Playgrounds.

For students and educators, it would broaden device requirements for Swift Playground materials, opening up learning opportunities for people who have access to Macs but not to iOS devices.

Finally, and perhaps most importantly for the developer ecosystem as a whole, it would eliminate the frustratingly problematic Xcode Playgrounds and hopefully provide developers with something more inspiring, more functional, and more reliable.

Radar #36910249.

App Store Upload Failures

I’ve been running into failures to connect to iTunes Connect through Application Loader. Others corroborate similar problems uploading through Xcode. The nut of the problem comes down to a failure to authenticate a specific Apple ID. The failure string is “Unable to process authenticateWithArguments request at this time due to a general error”:

Image of the Sign In window for Application Loader showing a failure message

Whatever is going on, it’s somewhat sporadic. It started failing for me about 48 hours ago, and briefly started working again yesterday, but only for a few hours. Changes of network, computer, even clearing out all the app preferences and data for Application Loader, seem to have no impact on the issue.

I’ve filed a bug with Apple (Radar #36435867), and discovered a workaround you can use in a pinch: add another Developer ID to your team. I was able to grant admin privileges to a second Apple ID I control, and use it to log in and upload to my account. I’m not sure if this workaround requires a “company” style developer account, or if it can also be used for individual accounts.

Intrinsic String Encoding

I was baffled today while investigating a bug in MarsEdit, which a customer reported as only seeming to affect the app when writing in Japanese.

I pasted some Japanese text into the app and was able to reproduce the bug easily. What really confused me, though was that the bug persisted even after I replaced the Japanese text with very straight-forward ASCII-compatible English. I opened a new editor window, copied and pasted the English text in, and the bug disappeared. I copied and pasted back into the problematic editor, and the bug returned. What the heck? Two windows with identical editors, containing identical text, exhibiting varying behavior? I knew this was going to be good.

It turns out there’s a bug in my app where I erroneously ask for a string’s “fastestEncoding” in the process of converting it. The bug occurs when fastestEncoding returns something other than ASCII or UTF8. For example, with a string of Japanese characaters, the fastestEncoding tends to be NSUnicodeStringEncoding.

But why did the bug continue to occur even after I replaced the text with plain English? Well…

The documentation for NSString encourages developer to view it as a kind of encoding-agnostic repository of characters, which can be used to manipulate arbitrary strings, converting a specific encoding only as needed:

An NSString object encodes a Unicode-compliant text string, represented as a sequence of UTF—16 code units. All lengths, character indexes, and ranges are expressed in terms of 16-bit platform-endian values, with index values starting at 0.

This might lead you to believe that no matter how you create an NSString representation of “Hello”, the resulting objects will be identical both in value and in behavior. But it’s not true. Once I had worked with Japanese characters in my NSTextView, the editor’s text storage must have graduated to understanding its content as intrinsically unicode based. Thus when I proceeded to copy the string out of the editor and manipulate it, it behaved differently from a string that was generated in an editor that had never contained non-ASCII characters.

In a nutshell: NSString’s fastestEncoding can return different values for the same string, depending upon how the string was created. An NSString constant created from ASCII-compatible bytes in an Objective-C source file reports NSASCIIStringEncoding (1) for both smallest and fastest encoding:

printf("%ld\n", [@"Hello" fastestEncoding]);	// ASCII (1)

And a Swift string constant coerced to NSString at creation behaves exactly the same way:

let helloAscii =  "Hello" as NSString
helloAscii.fastestEncoding			// ASCII (1)

But here’s the same plain string constant, left as a native Swift String and only bridged to NSString when calling the method:

let helloUnicode = "Hello"
helloUnicode.fastestEncoding		// Unicode (10)

As confusing as I found this at first, I have to concede that the behavior makes sense. The high level documentation describing NSString representing “a sequence of UTF-16 code units” says nothing about the implementation details. It’s a conceptual description of the class, and for the most part all methods operating on an NSString comprising the same characters should be heave the same way. But the documentation for fastestEncoding is actually pretty clear:

“Fastest” applies to retrieval of characters from the string. This encoding may not be space efficient.

As I said earlier, my usage of fastestEncoding was erroneous, so the solution to my bug involves removing the call to the method completely. In fact, I don’t expect most developers will ever have a legitimate needs to call this method. Forthose who do, be very aware that it can and does behave differently, depending on the provenance of your string data!

Treat Warnings as Errors in Swift

For years I have maintained a zero-tolerance policy for warnings in shipping code. To help me enforce this, my “Release” build configurations define the build setting that induces Xcode to “treat warnings as errors”:

GCC_TREAT_WARNINGS_AS_ERRORS = YES

The comedy of this build setting is that it references “GCC,” a compiler that increasingly few of us even remember Apple ever using for macOS or iOS development. Apple’s fork of the popular open-source compiler was the standard for years, until Apple debuted clang, which is built on the LLVM framework.

It’s always been kind of annoying that, as time moved on, we were stuck specifying important build settings with names that included “GCC,” but I accepted it. After all, I configure the vast majority of these settings in “.xcconfig” files that I reuse in all my projects, so I almost never interact with them directly.

As I’ve started to shift some of my code from Objective-C to Swift, I assumed that my ancient GCC build setting would ensure that I don’t ship any builds with warnings. But today I realized that I had built a release build that didn’t treat a warning as an error. What’s the deal?

It looks like Apple has decided to break with tradition and establish a new build setting for Swift:

SWIFT_TREAT_WARNINGS_AS_ERRORS = YES

Adding this to my .xcconfig file breaks the build when a warning is generated, and prevents me from accidentally shipping code that is known to be vulnerable to unexpected behavior. I think it would have been a nice touch if Apple had inferred SWIFT_TREAT_WARNINGS_AS_ERRORS when GCC_TREAT_WARNINGS_AS_ERRORS is set, so I’ve filed a bug requesting that it does. Radar #35352318.

Selective Selector Mapping

I ran into an interesting challenge while porting some Objective-C code to Swift. The class in question served both as an NSTableView delegate and data source, meaning that it implemented methods both for controlling the table view’s behavior and for supplying its content.

Historically in Cocoa, most delegate relationships were established as informal protocols. If you wanted a particular class to be a table view data source, you simply implemented the required methods. For example, to populate a cell based table view, a data source would implement various methods, including one to indicate how many rows the view should have:

- (NSInteger) numberOfRowsInTableView:(NSTableView *)tableView;

In recent years, Apple has increasingly converted these informal protocols to formal Objective-C protocols. These give the compiler the opportunity to generate errors if a particular class declares compliance, but neglects to implement a required method. At runtime, however, the compliance-checking is still pretty loose. NSTableView consults its data source, checks to see that it implements a required subset of methods, and dynamically dispatches to them if it does.

The dynamic nature of NSTableView hasn’t changed with Swift. An @objc class in Swift that complies with NSTableViewDataSource must still implement the required methods such that Apple’s Objective-C based NSTableView can dynamically look up and dispatch to the required delegate methods. Swift’s method rewriting “magic” even ensures that a delegate method can be written in modern Swift style, yet still appear identically to older Objective-C code:

class MyDataSource: NSObject {
	@objc func numberOfRows(in tableView: NSTableView) -> Int {
		return 0
	}
}

Given an instance of MyDataSource, I can use the Objective-C runtime to confirm that a the legacy “numberOfRowsInTableView:” selector is actually implemented by the class above:

let thisSource = MyDataSource()
thisSource.responds(to: Selector("numberOfRowsInTableView:")) // false

Or can I? False? That’s no good. I’m using the discouraged “Selector” initializer here to ensure I get Swift to look for a very specific Selector, even if it doesn’t appear to be correct to the Swift-adapted side of the runtime.

I was scratching my head, trying to figure out why Objective-C could not see my method. Did I forget an @objc marker? No. Did I forget to make MyDataSource a subclass of NSObject? No. I finally discovered that I could second-guess the default Swift selector mapping to obtain a result that “worked”:

class MyDataSource: NSObject {
	@objc func numberOfRowsInTableView(_ tableView: NSTableView) -> Int {
		return 0
	}
}

let thisSource = MyDataSource()
thisSource.responds(to: Selector("numberOfRowsInTableView:")) // true

Instances of MyDataSource will get the job done for Objective-C calls to “numberOfRowsInTableView:”, but I’ve lost all the pretty formatting that I expected to be able to use in Swift.

There’s something else I’m missing out in my Swift implementation: type checking of MyDataSource’s compliance with the NSTableViewDataSource protocol. Old habits die hard, and I had initially ported my class over with an old-fashioned, informal approach to complying with NSTableViewDataSource: I declared a plain NSObject that happens to implement the informal protocol.

It turns that adding that protocol conformance onto my class declaration not only gains me Swift’s protocol type checking, but changes the way key functions are mapped from Swift to Objective-C:

class MyDataSource: NSObject, NSTableViewDataSource {
	func numberOfRows(in tableView: NSTableView) -> Int {
		return 0
	}
}

let thisSource = MyDataSource()
thisSource.responds(to: Selector("numberOfRowsInTableView:")) // true

Armed with the knowledge that my class intends to comply with NSTableViewDataSource, Swift generates the expected mapping to Objective-C. Notice in this final case, I don’t even have to remember to mark the function as @objc. I guess when Swift is creating the selector mapping for a function, it does so in a few phases, prioritizing more explicit scenarios over more general:

  1. First, it defers to any explicit annotation with the @objc attribute. If I tag my “numberOfRows…” func above with “@objc(numberOfDoodads:)” then the method will be made available to Objective-C code dynamically looking for “numberOfDoodads:”.
  2. If there’s no @objc specialization, it tries to match function implementations with declarations in superclasses or protocols the class complies with. This is what gives us the automatic mapping of Swift’s “numberOfRows(in:)” to Objective-C’s “numberOfRowsInTableView:”.
  3. Finally it resorts to a default mapping based on Swift API Design Guidelines. This is what yielded the default “numberOfRowsIn:” mapping that I first encountered.

This is an example of a Swift growing pain that is particularly likely to affect folks who are adapting older source bases (and older programming mindsets!) to Swift. If you run across a completely vexing failure of Objective-C to acknowledge your Swift class’s protocol compliance, start by making sure that you’ve actually declared the compliance in your class declaration!